
The largest reservoir in the SFPUC’s regional water system, Hetch Hetchy serves over 2.5 million people in the Bay Area every day. © San Francisco Public Utilities Commission; Photo by Katherine DuTiel
This article is excerpted from the SPUR report Future-Proof Water. Read the complete report at spur.org/futureproofwater >>
For more than a century, water supply and management has been one of the most enduring and complex policy issues in California. Monumental investments in water delivery and infrastructure — largely to move water from north to south and east to west — supported the state’s economic expansion and urban growth in the 20th century. Today, this water delivery system is aging and ever more at risk from new challenges like climate change, sea level rise, earthquakes and a public mandate to reduce impacts on ecosystems and endangered species. As key parts of the system are retrofitted [1] or even reconsidered altogether,[2] demand for water is growing rapidly: California’s population is expected to grow by more than 50 percent by 2050, increasing the competition for available water supplies.
The Bay Area, which relies on imported water from the Sierra Nevada and the Sacramento-San Joaquin Delta for two-thirds of its water supply, is also growing. Our region, home to more than 7 million people in 2012, is expected to add 2 million more by 2040 — accommodating one-quarter of the state’s expected growth of 8 million people by this time. This growth will require reliable and safe water. There are many ways to optimize our existing water supplies further into the future, through efficiency, demand management, conservation, plumbing code changes and other efforts to reduce per capita water use. This article will describe such policies and programs in more detail. But existing supplies are at risk even today from drought, earthquakes, water quality impairments, new regulations on availability and usage, and more — risks that are very likely to grow as the climate changes.
This article distills the findings of SPUR’s newly released report, Future-Proof Water, which aims to answer two questions:
SPUR has a long history of supporting San Francisco’s water infrastructure and development projects, from Propositions B and E in 2002, which funded the San Francisco Public Utilities Commission’s Water System Improvement Program, to more recent efforts to recycle water and legalize onsite water reuse in new large developments.[3] In our 2011 report, Climate Change Hits Home, we briefly discussed the potential impacts of climate change on water systems.[4] We recommended that Bay Area water supply agencies plan for climate change through at least the end of the century and prioritize alternative water supply opportunities and demand-management strategies according to cost, reliability and environmental benefits. We specifically encouraged agencies to evaluate locally available drought-proof strategies such as conservation, water recycling and desalination.
Here, we describe the region’s current water systems and supplies, future availability of those supplies, future water demand and options for meeting that demand. We also recommend which types of water supplies will be our most reliable and sustainable long-term options.
The Bay Area’s water systems are managed by a network of special districts, city and county agencies, and private companies. There are more than 100 water retailers and wholesalers in the region, who serve residential, commercial, industrial and agricultural users. Water supply to the vast majority of urban users in the Bay Area is managed by 11 major water agencies (Figures 1 and 2). These agencies have diverse supply portfolios, which include local groundwater and surface water, recycled water (treated wastewater for approved uses), water imported directly from major Sierra rivers and the Delta (Figure 3).
Agency portfolios tend to depend upon local geography, historic water rights and imported water contracts. For example, the San Francisco Public Utilities Commission (SFPUC), which serves 2.6 million people in San Francisco, San Mateo, Alameda and Santa Clara counties, receives 85 percent of its water from the Tuolumne River and 15 percent from local supplies, including Alameda Creek. The Santa Clara Valley Water District (SCVWD), a wholesale supplier in Santa Clara County, supplies about 50 percent of its water from local surface water and groundwater and 50 percent from imported water sourced from the State Water Project (SWP) and Central Valley Project (CVP), in addition to supplies delivered to the county by the SFPUC. The Bay Area also has 28 major groundwater basins, underlying about 30 percent of the region.[5]
FIGURE 1: Major Urban Water Agencies In the Bay Area
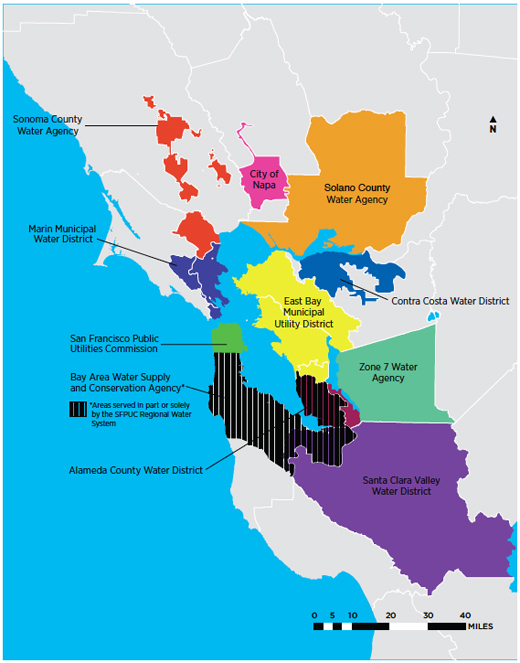
11 water agencies serve 7.1 million people in the metropolitan Bay Area and beyond.
Source: Bay Area Integrated Regional Water Management Plan (November 2006), p. B-6.
Four major conveyances or water systems supply two-thirds of the region’s water from the Delta and the Sierra Nevada (see Figure 2):
FIGURE 2: Sources of Regional Water Supply
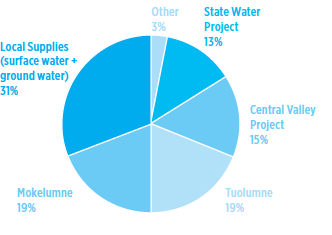
The region’s water comes from diverse sources, but two-thirds of it is imported from outside the region.
These major water systems convey the region’s everyday water supplies, but water agencies also mitigate the risk of drought with supplemental dry-year supplies. Many participate in water transfer agreements, which may be either short-term, one-time deals, typically lasting a year or less, or long-term agreements that may provide urban water agencies with supplies when available or an option to buy supplies in dry years. These transfers and long-term agreements are typically made with local irrigation districts or agricultural suppliers.
Some agencies also participate in innovative water management programs to store water in the ground in wet years for use in dry years. Some have groundwater basins with available space for storage, enabling them to practice conjunctive use, a joint management strategy for surface and groundwater supplies where aquifers are used to store water in wet years and drawn down in dry years. Some agencies participate in faraway water banks to serve a similar purpose.
The region’s major water suppliers have a history of cooperating to achieve shared goals. In 2006, water resource managers in the region worked together on a massive regional planning project, the Bay Area Integrated Regional Water Management Plan,6 which is being updated again in 2013. This plan is a comprehensive assessment of water resource challenges and opportunities in the region, including water supply, water quality, habitat management and flood-control issues. Its completion (and update) will allow the region to access significant state funding for projects included in it and work toward region-wide goals such as improving the seismic reliability and climate resilience of water resource systems.
FIGURE 3: Major Water Infrastructure in the Bay Area
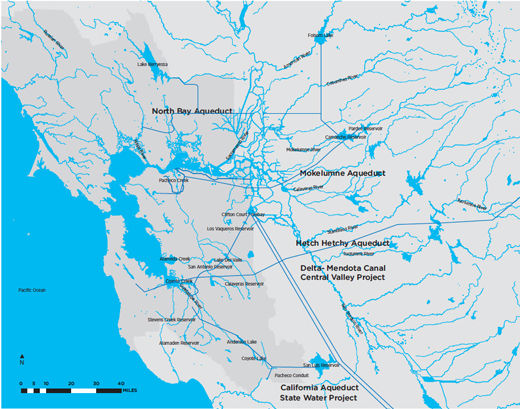
The Bay Area is highly dependent on imported water from four primary sources, and it conveys, pumps and treats water in several interconnected systems. (Additional local reservoirs, wells and pipelines are not shown on this map.)
Source: Bay Area Integrated Regional Water Management Plan (November 2006), p. B-21.
In case of emergencies such as severe seismic events, regional water agencies have also constructed interties to connect their systems and deliver water where it is needed in the event of an outage. For example, the SFPUC’s Hetch Hetchy system is intertied with EBMUD’s and SCVWD’s systems; 25 Bay Area Water Supply and Conservation Agency (BAWSCA) member agencies are intertied; and EBMUD is intertied with CCWD and other neighboring agencies. But while these interties are valuable from a reliability and emergency preparedness perspective, they are not a source of new supplies to meet the region’s growing demand.
Although critical, these interconnections do not protect the region from earthquakes that could damage many miles of pipelines and other water system infrastructure. According to the U.S. Geological Survey, there is a 62 percent chance that a magnitude 6.7 or greater earthquake will occur in the Bay Area in the next 30 years. More than 93 percent of critical water system facilities in the region are exposed to high ground shaking levels.[7] If the Hayward fault in the East Bay ruptures, the Hetch Hetchy, Mokelumne and South Bay aqueducts and numerous local pipelines could be damaged; some local dams are also on or near faults. Using data from the 1989 Loma Prieta earthquake, the Association of Bay Area Governments estimates that 6,000 to 10,000 water pipeline ruptures could occur following a Hayward fault event. Many agencies have funded major improvements to the seismic reliability of their water systems, such as the SFPUC’s $4.6 billion Water System Improvement Program.
FIGURE 4: How Much Will Our Water Needs Grow in the Next 20 Years?
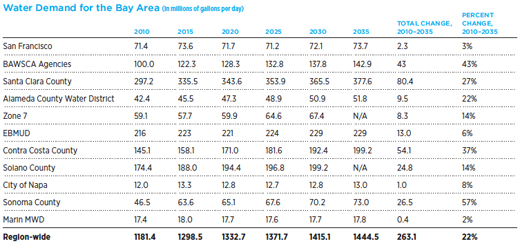
Demand for water will grow more quickly in some parts of the region than in others. As a whole, the Bay Area will demand 22 percent more water in 2035 than it did in 2010.
Source: SPUR analysis of 2010 Urban Water Management Plans of all 11 agencies.
Perhaps the greatest remaining seismic risk to the Bay Area’s water supply is the potential of earthquake- caused levee failure in the Delta, which provides water to 25 million people in California. Much of the land in this region is below sea level and protected by more than 1,000 miles of earthen levees. If these fail, salt water from San Francisco Bay will flow into the Delta and enter the drinking water system; if 20 islands in the Delta are flooded as the result of an earthquake (of which there is a 55 percent probability in the next 25 years), export of freshwater from the Delta could be interrupted for a year and a half. Water districts that wholly rely on Delta supplies, such as CCWD, are especially vulnerable to such an event. If they haven’t already, Bay Area water suppliers should assess their system vulnerabilities to earthquakes and conduct retrofits of critical lifeline infrastructure to minimize damages from future disasters.
The Bay Area’s 11 major urban water suppliers served 7.1 million people in their service areas in 2010. By 2035, that population is projected to grow by 25 percent to almost 9 million people (Figure 5). Projected population growth across the region will not occur evenly; some water districts will have a faster rate of growth than others. This means that demand for and pressure on existing water supplies will be more intense in some parts of the region than others. Projected employment growth in the region through 2035 is also significant — about 1.1 million jobs, of which about one-third can be accommodated in existing development.[8] Most of the job growth will be in the knowledge, health and education, and leisure and hospitality sectors, all of which are relatively water intensive among commercial and institutional users. Together, the residential and commercial/institutional sectors are the two largest customer types served by urban water agencies in California, with residential use accounting for two-thirds of all urban water use.
How does this growth translate into water demand projections? California water agencies with more than 3,000 connections (separately metered customers) are required to prepare an Urban Water Management Plan (UWMP) every five years, describing existing supplies, planned supplies, projected demands and drought contingency plans at least 20 years into the future.[9] To forecast future demand, a simple approach is to multiply current per capita water use by projected population growth in an agency’s service area. For the past 30 years in California, this relationship between population and water demand has been closely correlated.[10] But most agencies actually have a much more complicated water demand model, factoring in projected land-use changes in their service territories, plus three important trends:
SPUR’s analysis of all 11 agencies’ Urban Water Management Plans shows that across the Bay Area, water demand in normal years, not accounting for the impact of climate change, will grow by 263 mgd between 2010 and 2035 (Figure 4). Agencies vary widely in their projections, from a 2–3 percent increase in San Francisco and Marin to double-digit increases on the Peninsula, in Santa Clara County and in the East Bay. For the Bay Area as a whole, growth in water demand is slightly less than population growth over the 2010–2035 period, indicating the region will become slightly more water-efficient over time.
Water efficiency is generally measured by per capita demand (gallons per capita per day, or gpcd), which is the total amount of water used in a service territory divided by the total population. Water agencies typically also report residential per capita demand as a subset of total per capita demand. This is a better metric for apples-to-apples comparisons across service territories but does not provide a complete measure of water use because it does not account for commercial, agricultural and industrial use. As such, this report focuses on total water demand and use, which will determine where the Bay Area looks for future water, and how much it must find.
In general, Bay Area urban water users are relatively efficient compared to other areas in California. While San Francisco’s per capita use is below 100 gpcd, in 2010, the Peninsula and Alameda County averaged 137 gpcd and SCVWD averaged 163 gpcd. By contrast, some water districts in warmer and less dense parts of California, such as the Central Valley, use 200–300 gallons per person per day. [12]
The form of future growth, and the land use changes that accompany it, could significantly affect demand. If we accommodate the 2 million people moving to the Bay Area between now and 2035 in more compact urban areas and multifamily dwellings, we could reduce water use from a business-as-usual scenario.[13] It has been well documented that large lots are a major contributor to both residential and commercial water use, largely due to landscape uses: Nationwide, lawn care alone accounts for an average of 50 percent of household water use.[14] More compact development also allows for shorter transmission systems, reducing leak losses and reducing energy needs for pumping and pressurization. Infill development leverages ratepayers’ investment in existing water delivery infrastructure while sprawl development increases capital and maintenance costs for all users. In short, smart growth can reduce both the cost of water provided to ratepayers and the quantity of water they demand.
 Water utilities, however, have little control over land use and the growth patterns of their service territories. California’s Senate Bills 610 and 221 (2001) require water supply assurances for new development but do not include water budgeting or mandate efficiency measures. SB 610 requires every large development project to have a water supply assessment, and SB 221 requires cities and counties to condition approval of new residential subdivisions on the availability of a sufficient water supply. Most UWMPs, as 20-year water master plans, satisfy agencies’ compliance with SB 610 and SB 221.[15] But the responsibility for minimizing future water demand through better land use planning and compact development lies with planning agencies and regional growth management agencies. These agencies and elected officials, who approve new large projects, could do more to consider water issues and to require that new development meet or exceed efficiency standards; such a goal could be accomplished by requiring water-neutrality or creating a green building program with stricter requirements than CALGreen.
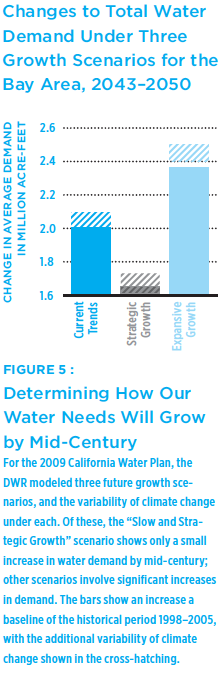
For the 2009 California Water Plan, DWR evaluated water demand projections for the Bay Area hydrologic region through 2050 based on three future growth scenarios (Figure 5). Without climate change, DWR found that two of these three scenarios — “Current Trends” and “Expansive Growth” — show an increase in urban water demand of 350,000 acre-feet and 800,000 acre-feet (312 mgd and 714 mgd), respectively, while “Slow and Strategic Growth” shows a reduction from the historical average (1998–2005).[16] When climate change is factored in, the increase in urban water demand is even larger under “Expansive Growth.” This model clearly indicates that if the region does not grow in a strategic and compact way, emphasizing water efficiency and conservation, we will need to find significant sources of new supply to meet our needs in the future — in a normal water year, let alone during a drought.
Looking even further into the future, SPUR used a model developed by the Pacific Institute to examine the effect of certain parameters on the region’s water use out to the year 2100. The model allows users to estimate urban water use based on a variety of input parameters, such as population, climate change, household type, conservation measures and more. We selected three test variables to determine their effect on future urban water use in the San Francisco Bay Area hydrologic region: [17]
In every scenario (Figure 6), we will need more water for the Bay Area than we use today. If we are very successful at sustaining conservation through midcentury and there is minimal climate change, we may use as little as 4 percent more water than we did in 2000. But if we sustain conservation gains only through 2020, as required by SB X7-7, and climate change is severe, we may demand 47 percent more water by the end of the century.[18] This is equivalent to more than half a million acre-feet a year, or 508 mgd.
Our model results, and DWR’s, clearly indicate that the water needs of the future are not certain and that demand may vary significantly, depending on numerous controllable and uncontrollable factors. In the following section, we discuss some of the challenges regional water agencies will face to ensure that supplies at least meet near-term future demand.
Meeting future water demand with adequate supply is one of the most important planning functions of a water utility. Most water agencies are actively working to secure sufficient water supplies for projected demand within about a 30-year planning horizon. SPUR’s analysis of urban water suppliers in the Bay Area shows that most agencies can meet projected demand in a normal water year with existing or planned supplies during the UWMP planning window of 2010–2035 (Figure 7).
But in a dry year, very dry year or multiple dry years in a row, there is not enough supply to meet demand, even now. By 2035, if no demand-reduction measures are taken and no new supplies are planned, supply will be about 21 percent short of total demand. This gap is more severe for some agencies than for others. For example, the City and County of San Francisco’s projected demand is well below expected supply levels, even in a multiple-dry-year scenario. However, the city is alone in this distinction. The 10 other water agencies in the region cannot meet projected 2035 demand in either a dry-year or a multiple-dry-year scenario.
Having sufficient water supplies on hand to meet 100 percent of normal-year demand in a multipledry- year situation is not the normal business practice of water agencies. In fact, this level of service could lead to overbuilding of water infrastructure at great expense to ratepayers. The level of acceptable shortage in a dry year is a policy choice — adopted by water utilities, their governing boards and elected overseers. Based on the chosen level, these utilities procure supplies, participate in short-term transfers and develop drought-management and rationing plans. Although the region as a whole will fall 21 percent short of demand in a multiple-year drought by 2035, some agencies will have much more severe gaps between supply and demand by this time — a few as high as 33 percent and one as high as 51 percent. But levels of shortage beyond 10–15 percent may have disproportionately high economic impacts[19] and may not even be achievable through voluntary measures. Prolonged shortages much greater than these levels could cause economic loss, compromise public health and lead to poor social outcomes.
FIGURE 6: How Much Will Our Water Needs Grow by Century’s End?
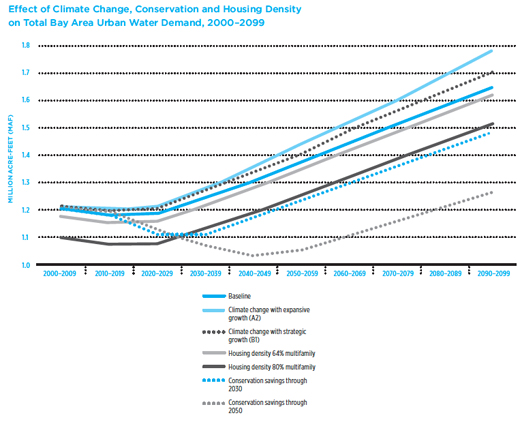
Under every scenario, the Bay Area will need more water by 2100 it used in the baseline period, 2000-2009. Unless we are extraordinarily successful at water conservation and efficiency and can extend the current pace of savings through 2050, water demand could increase by as much as 47 percent by 2100. Note: Our model does not show the potential combined effects of these factors on water use.
Source: SPUR analysis using a model published by the Pacific Institute.
Although the exact timing and magnitude of future climate change impacts are uncertain, consensus is growing around their general trajectory — a consensus SPUR described in its 2011 report, Climate Change Hits Home.[20] As the climate changes, the Sierra snowpack that provides natural water storage for freshwater supply — essential for many Bay Area water agencies — is likely to melt earlier and more rapidly (Figure 9). Longer and drier droughts are predicted before the end of the century, leading to an increasing frequency and magnitude of water shortages and exacerbating conflict over an already-stretched resource. Across the state, more precipitation will fall as rain instead of snow, leading to water-storage challenges for a system that has been designed to capture slow and steady snowmelt. Higher air temperatures will increase water uptake by plants, increase evaporation and decrease soil moisture, resulting in less water flowing into reservoirs. These higher temperatures will also increase water demand across all sectors, and higher water temperatures could impair water quality.
Groundwater basins used for water supply are threatened with decreased replenishment from lowered precipitation and increased evaporation. And coastal freshwater aquifers may become more vulnerable to saltwater intrusion from sea level rise. Saltwater intrusion into coastal aquifers would make some of the freshwater unusable without more intensive treatment. A combination of increased storm intensity and sea level rise into the Sacramento-San Joaquin Delta could increase the risk for flood-caused levee failures, which could destroy low-lying areas and contaminate freshwater supplies stored and conveyed in the Delta.
FIGURE 7: Regional Water Supply vs. Demand
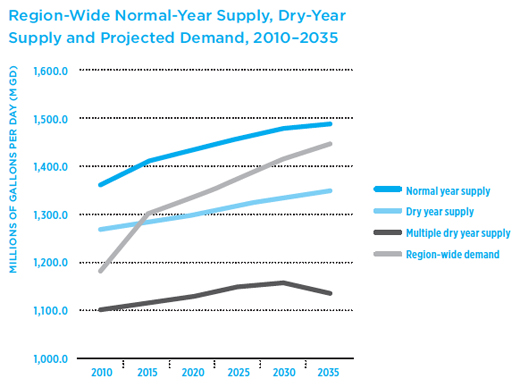
As of 2010, in normal water years, there is a surfeit of water compared to demand. By 2035 the size of the surplus will be much smaller due to increases in demand. In very dry years, there will not be enough water to meet demand even today.
Source: SPUR analysis of 2010 Urban Water Management Plans of all 11 agencies.
Some water utilities serving the Bay Area, including East Bay MUD and the SFPUC, have undertaken water supply modeling to understand shifts in the quantity and timing of runoff that may occur due to climate change. East Bay MUD and the SFPUC have found that because of the high altitude and capacity of their storage reservoirs, along with other factors, climate change may not significantly affect water deliveries through about 2020–2030. San Francisco’s Hetch Hetchy watershed is somewhat protected by its high elevation, where the magnitude of predicted changes in snowpack and melt through 2030 is within the range of existing runoff patterns. [21]
However, in projecting future changes, the utilities are in the process of factoring in net changes in precipitation, the impact of which may be much more significant by midcentury and beyond. For example, the SFPUC has evaluated changes to runoff into its largest reservoir, Hetch Hetchy, for various climate change scenarios in 2040, 2070 and 2100. By 2100, depending on temperature trends and precipitation (increases or decreases), median annual runoff may increase 2 percent or decrease as much as 29 percent. But in a critically dry year, in a scenario of high temperature increases and precipitation decreases, runoff may be 47 percent below the median annual runoff in 2010. [22]
While the idea of a water shortage in future dry years seems alarming, it is not yet a crisis. Water agencies generally do not have extra water supplies on hand today in case of a severe or prolonged drought 30 years from now. But planning tools like UWMPs, long-term water supply plans built upon them (such as East Bay MUD’s Water Supply Management Plan and SCVWD’s Water Supply and Infrastructure Master Plan) and, more recently, climate models can help agencies understand when future shortfalls may occur, and how severe they may be, so that agencies can plan to develop new supplies and/ or demand-management measures in the meantime. This report seeks to help with the process of prioritizing where these future supplies, or savings, should come from.
Water agencies can meet projected future demand in two ways: either by lowering demand or increasing supply (or both). In our report Future-Proof Water, we describe a variety of tools within each of these categories, their advantages and disadvantages, average costs and some examples from the Bay Area, where possible. Then we provide an analysis of these options and propose priorities for future supplies for the region based on our assessment.
We recognize that water agencies in the Bay Area face unique supply and demand challenges in their service territories. Some have more commercial use than others, some serve agricultural users, some contain larger landscapes to irrigate and some have more reliable historic water rights than others. Because of this geographic and user diversity, we don’t recommend a one-size-fits-all water supply strategy for everyone.
The region will add almost 2 million people by 2035, at which time existing water supplies will barely meet the region’s needs unless they are augmented in a significant way. It is not too early to begin planning for water supplies in 2035 and beyond. SPUR recommends that the Bay Area’s major urban water suppliers, their customers, land use planning agencies, elected leaders and integrated regional water management and planning efforts do the following:
1. Develop water supply scenarios for mid-century and beyond that include assumptions about changes (especially decreases) in precipitation amounts and timing.
Although Urban Water Management Plans only require a 30-year outlook, water agencies should look further into the future in light of climate change and the uncertain pace of the region’s growth. As little as 20 percent of the Sierra snowpack, which provides most of California’s urban water, may be available by the end of this century. Modeling conducted by the SFPUC for its customers in three Bay Area counties suggests that by the end of the century, under drought conditions, much higher temperatures and less precipitation, runoff from Hetch Hetchy may be less than half of what it is today. Water agencies must consider potential impacts of climate change both in terms of reductions in supply —and more competition for new supplies — and increases in demand. Agencies should plan ahead at least 50 years and evaluate the vulnerability of their service territories and supply portfolios to a range of future climate scenarios.
2. Evaluate the vulnerability of water supply and delivery systems to earthquakes, develop risk-reduction plans and invest in reliability upgrades to meet service goals.
In SPUR’s report on earthquakes and lifeline infrastructure, we recommended target levels of service for water supply following an earthquake. SPUR recommended that water service be 100 percent restored for critical earthquake response functions, such as firefighting, within four hours of an event. We recommended that 90 percent of a system’s customers have water service restored within three days, and 95 percent of customers have water service restored within 30 days. Water utilities should use these metrics, or adopt similar ones, to evaluate system vulnerabilities and to plan reinvestments in their critical lifeline infrastructure, if they haven’t already. Because two-thirds of the region’s water supply is imported from outside the region and major aqueducts to the region cross several earthquake faults, resilient pipelines and reliable water service are critical to the health and welfare of our growing population.
FIGURE 8: Projected Decreases in California’s Snowpack
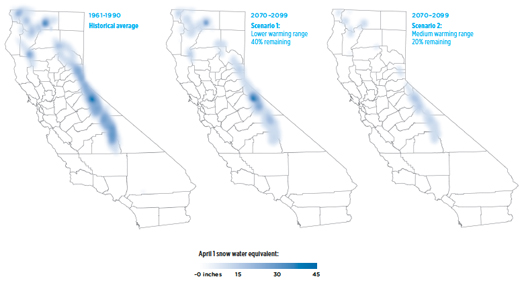
The Sierra snowpack provides water to the majority of Californians. By the end of this century, as little as 20 percent of the Sierra snowpack may exist under hotter, drier conditions caused by climate change.
Source: Dan Cayan et al. (2006), in the California Climate Adaptation Strategy (2009), p. 80. www.energy.ca.gov/2009publications/CNRA-1000-2009-027/CNRA-1000-2009-02…
3. Prioritize demand-management measures, especially water efficiency and conservation best management practices, as a least-cost, highly reliable and low-environmentalimpact strategy for meeting future water needs.
4. Require new development to be highly water-efficient through green building ordinances, and/or by requiring waterneutrality as a condition of development for new large developments.
The more the region invests in compact development and reducing outdoor water use, the more water-efficient it will be in the future. Green building programs can require new construction or major retrofits to achieve water efficiency standards above and beyond state building code requirements. For example, San Francisco’s Green Building Ordinance requires 30 percent water savings compared to baseline water use, whereas CALGreen, the state code, only requires 20 percent. Water-neutrality requires developers to fund demand offsets, or retrofits, within the service territory of a new development to meet that new development’s demand, resulting in a “zero water” footprint for the new project.
5. After demand-management measures are fully implemented, prioritize development of new water supplies in the following order:
a. Conjunctive use, carefully monitored groundwater projects and indirect/direct potable reuse projects. These types of projects tend to be highly reliable, and to have a medium to low environmental impact. Indirect and direct potable reuse are superior choices to traditional recycled water because they produce water of a high enough quality for all possible end uses and do not require construction of a separate distribution system. However, these supplies will tend to be more important farther in the future, especially as potable reuse is currently under review and not permitted in California. Groundwater, particularly when replenished with surface supplies through conjunctive use, is generally a more sustainable type of water supply if it is carefully monitored and managed to ensure that replenishment rates meet or exceed extraction rates. In some basins, groundwater extraction could impair water quality due to saltwater intrusion or cause land subsidence, but careful monitoring and groundwater basin management can prevent such occurrences.
b. Recycled water, onsite reuse and district-scale systems, and banking and transfers. These relatively drought-proof supplies provide reliability and have various environmental impacts, such as increasing energy use. Recycled water, a drought-proof supply that has limited end uses, due to its nonpotable nature, can offset potable water demand, saving the highest-quality supplies for potable uses. But because it is not drinkable, it is of more limited value in a drought; greater bang for the buck can occur with potable reuse projects. Water and public health agencies should establish clear processes for permitting onsite reuse and district-scale systems, which may be the most feasible for new large buildings and new large developments. Banking and transfers can help the Bay Area import large quantities of water during dry years.
c. Desalination and development of new surface water supplies and surface storage. These supplies can have a lower sustainability profile. Desalination is generally more expensive on a per-unit basis than other types of projects using a similar treatment process such as potable reuse projects and recycled water. New surface water may not even be available in a multiyear drought, and additional diversions from river systems may have adverse ecological impacts. New surface storage may be a necessary future climate adaptation strategy, but groundwater storage (where possible) is more sustainable, and increasing dam heights or impounding reservoirs will flood acres of natural habitat.
6. Employ water rationing as a temporary emergency measure only.
Rationing only produces water savings on a temporary basis and has significant negative economic impacts.
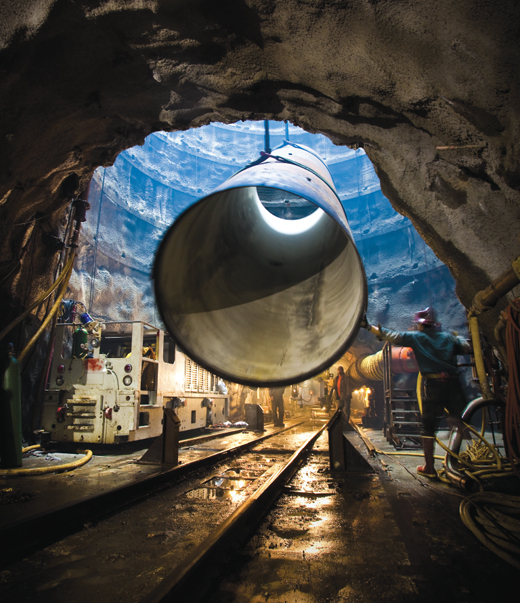
The New Crystal Springs Bypass Tunnel, part of the SFPUC’s Water System Improvement Program, replaced aging pipelines subject to earthquakes and landslides. © San Francisco Public Utilities Commission; Photo by Katherine DuTiel
Due to good planning, investment and ongoing reinvestment in infrastructure, and secured water rights and contracts, in normal water years most parts of the Bay Area have the water supplies necessary to accommodate growth and meet demand through 2035. Over the long term, as the region continues to grow and as climate change affects the reliability of available supplies, demand is likely to exceed existing supplies.
SPUR recommends that the region meet our future water needs by investing in conservation and efficiency and by requiring retrofits of existing development and water-neutrality for new development. To meet remaining and future needs, where possible, we recommend that urban water supply agencies first develop any necessary new supplies through conjunctive use, groundwater and potable reuse projects, which provide both reliability and sustainability better than other new water tools. Second, agencies should develop recycled water, participate in water banking and transfers and create permitting processes for onsite reuse and districtscale projects that may be attractive to new large or campus-like developments. Finally, desalination, new surface water and new surface storage could be part of a long-term climate adaptation strategy, but these sources tend to have one or more problematic aspects: high cost per unit, higher environmental impacts or low drought reliability. These qualities will vary by project, so we urge water utilities to proceed very carefully with designing such projects to minimize environmental and ratepayer impacts.
The Bay Area has a strong set of institutions in its urban water agencies and regional associations of dischargers and suppliers, as well as effective water planning processes through five-year Urban Water Management Plans and the Integrated Regional Water Management Plan. But plans and projects are only as strong as the public’s acceptance of water management strategies allows. SPUR believes that our region must do more to build support for water efficiency, water-neutrality, integrated water management and water reuse as our best strategies for reliable, longterm urban water supply and environmental sustainability. This report is one contribution among many that will serve to build such a public consensus for the future.
This article is excerpted from the SPUR report Future-Proof Water. Read the complete report at spur.org/futureproofwater >>
ENDNOTES:
[1] Such as the San Francisco Public Utilities Commission’s Water System Improvement Program, a $4.6 billion seismic retrofit of the San Francisco and Peninsula water delivery system (www.sfwater.org/index.aspx?page=114).
[2] For example, the Bay Delta Conservation Plan (BDCP), a multistakeholder and multiyear planning process that resulted in a 2012 governor’s proposal to shift the Delta diversion point farther north and tunnel Sacramento water to the southern parts of the state (baydeltaconservationplan.com/)
[3] See www.spur.org/publications/library/policymemo/spur-supports-non-potable-…
[4] Climate Change Hits Home (May 2011) www.spur.org/adaptation
[5] Bay Area Integrated Regional Water Management Plan (November 2006), p. B-8, www.bairwmp.org
[6] For more information about the 2006 Integrated Regional Water Management Plan and the 2013 update, visit www.bairwmp.org
[7] ABAG, Water System and Disasters.
[8] ABAG and Metropolitan Transportation Commission, Plan Bay Area: Jobs-Housing Connection Scenario, Draft, March 9, 2012.
[9] AB 797, the Urban Water Management Planning Act, was adopted in 1983.
[10] Christian-Smith, Juliet, Matthew Heberger, and Lucy Allen, Urban Water Demand in California to 2100: Incorporating Climate Change, Pacific Institute, August 2012, p. 14. http://www.pacinst.org/reports/urban_water_demand_2100/full_report.pdf
[11] California Building Standards Commission, 2008 California Green Building Standards Code (California Code of Regulations, Title 24, Part 11, effective August 2009), p. 31, www.documents.dgs.ca.gov/bsc/2009/part11_2008_calgreen_code.pdf
[12] California Department of Water Resources (DWR), California Water Plan, Update 2009 (San Francisco Bay Hydrologic Region, Bulletin 160-09), p. SF-14,www.waterplan.water.ca.gov/docs/cwpu2009/0310final/v3_sanfrancisco_cwp2…
[13] Some of this denser development is already taken into account in UWMP long-term water demand estimates throughout the region, which commonly base future population estimates on ABAG demographic projections (which include local general plans, zoning changes and other land use factors).
[14] U.S. Environmental Protection Agency, Growing Toward More Efficient Water Use: Linking Development, Infrastructure, and Drinking Water Policies (date unknown), www.epa.gov/dced/pdf/growing_water_use_efficiency.pdf
[15] CA DWR, www.water.ca.gov/pubs/use/sb_610_sb_221_guidebook/guidebook.pdf
[16] DWR, California Water Plan.
[17] The Bay Area hydrologic region is a subset of the nine-county Bay Area that includes all the watersheds that drain to the bay. It is a slightly smaller region both geographically and population-wise than the entire service territories of the 11 major water agencies that we evaluate in this report.
[18] Christian-Smith et al., Urban Water Demand in California, pp. 48–49.
[19] SFPUC, Economic Impact Analysis: Water Supply Reduction (November 23, 2005), pp. 3–4.
[20] SPUR, Climate Change Hits Home (May 2011), www.spur.org/adaptation
[21] San Francisco Planning Department, “Programmatic EIR for the SFPUC Water System Improvement Program,” Case No. 2005.0159E, Master Responses to Comments, Section 14.11: Master Responses on Climate Change (2008), www.sf-planning.org/Modules/ShowDocument.aspx?documentid=8016
[22] David Behar, SFPUC, February 2012, www.cesm.ucar.edu/working_groups/Societal/Presentations/12/behar.pdf