“Planning indulges in the same world of image making that artists and advertisers do. Some of these images are at once analytical diagrams and artful, even mesmerizing, images. If planners have opted most often for dry imagery, it is still imagery, with all of the complicated and rich implications of that term. Every plan is an act of persuasion, an argument for an alternative way of life that attempts to posit or convince an audience of that alternative.” —Andrew Shanken
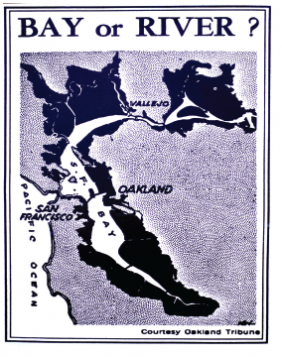
Figure 1: The “Bay or River?” diagram helped galvanize support for Save the Bay in the 1960s. Courtesy of The Oakland Tribune
Many of the ideas that have most influenced the shape of cities have been expressed through diagrams — simple visual statements that distill particular values, ideologies and policy agendas. A few have become iconic images, inspiring imitation, elaboration and critique. They are touchstones in the visual lexicon of urban planning and design.
This issue of The Urbanist and the accompanying exhibition at the SPUR Urban Center gallery investigate the iconography of city planning and the impact — for better or worse — of these images on the shape of urban communities in the United States. As new technologies enable new kinds of visualization, we pause for a look back at the field’s visual culture through 10 of its most influential diagrams, asking not only what planners were thinking about cities but also how they used the power of imagery to persuade and to communicate.
To planners, many of the images in this illustrated tour are instantly recognizable. Others may find them brand new or perhaps strangely familiar, either because they’ve been widely reproduced or because of the familiar places they’ve shaped and inspired.
Consider New York City’s 1916 Zoning Resolution. Some planning geeks may know its original illustrations. A few more will recognize Hugh Ferriss’ vivid renderings of its impact on a theoretical site or Fritz Lang’s imaginary city from the 1927 film Metropolis. But nearly everyone will recognize the Chrysler and Empire State buildings and the unmistakable form of midcentury Gotham that the policy generated.
Similarly, the township and section grid created by the 1785 Land Ordinance (see p. 9) may seem like a bit of arcane Federal Land Office history — until one connects it to the view of the Midwest from an airplane window, with its endless one-mile-by-onemile grid subdivided into square farm plots with pivot-irrigation circles. Fly at night into Chicago, Las Vegas or Phoenix, and the implications of this simple diagram on urban form become vividly apparent.
What Is a Diagram?
The word “diagram” (literally “marked out by lines” in Greek) refers to any schematic visual explanation of an idea. Diagrams take advantage of the differences between how our minds process language and how they process images. They are often set alongside a written or verbal argument to highlight a particularly important idea.
Charts, graphs and maps are all diagrams, and their particular syntax — of lines, arrows and shapes, often mixed with language — differs from the illustrative representation in drawings and photographs.
Diagrams seem to have a special power when it comes to the representation of place since they are able to combine spatial and nonspatial ideas. Pictures and data. Real and imagined worlds. Abstract ideas and concrete proposals. In this way, the diagram becomes a remarkably fertile space in which to explore the shaping of cities.
What Does a Diagram Do?
The power of a diagram is reductive: It distills a complex idea into a simple and powerful visual statement. Its clarity results from omission as much as inclusion, so it is often achieved at the expense of nuance and specificity. Unencumbered by pragmatic concerns, diagrams allow for experimentation and imaginative leaps.
At their worst, diagrams can become bases for exclusion or marginalization. The clean, compelling illustrations of the modernist city, with its abundant green space and efficient organization, helped cement the idea of “slum clearance” under the federal urban renewal programs of the 1950s and ’60s, for example.
But at their best, diagrams crystallize emerging points of view, framing challenges and choices in a new light, as when the Oakland Tribune’s arresting 1961 “Bay or River?” graphic helped to spur major new protections for San Francisco Bay. Similarly, the use of figure-ground maps by urban designers in the 1970s (see p. 16) vividly expressed the nebulous idea of urban pattern, making the case for its value in planning decisions. Once an insurgent view takes hold, its imagery often comes to represent a new orthodoxy, becoming the target of new critiques and new assertions.
Maps, Plans and Plan View
Every map is a diagram, in the sense that a map is an abstracted representation of some but not all facets of a place. This is essential: A road map that showed the details of the electrical power grid and mineral resources would be unnecessarily confusing.
Most maps compress both the curvature of the earth and its topography onto a two-dimensional plane with varying degrees of rigor, a leap of abstraction so commonplace that we scarcely notice it. Artists at least since Robert Rauschenberg have been working to confound that plane, and more recently, new tools from computer-aided design (CAD) to geographic information systems (GIS) have allowed designers to approach it ever more dynamically. It is worth remembering, however, that even the once unimaginable trick of casually flying through a three dimensional landscape on one’s desktop still happens on a flat surface. Our newfound technical prowess has only deepened our reliance on pictorial space.
The word “plan” implies forethought and aspiration, not simply a representation of what is. But at times, maps and plans converge. The contextualist revolt in city planning in the 1960s and ’70s insisted that a major part of the discipline consists of analytical mapping of existing conditions, in contrast with the grandiose erasures of modernist urbanism. The cognitive mapping of planners like Kevin Lynch and Donald Appleyard prefigured the explosion of alternative cartography and data visualization now made possible by digital media. The tools of cartography — and its tacit filtering of reality — have been radically democratized, and map-making has become a discourse in which artists, activists, tech nerds and planners can assert their own visions of what is and what ought to be.
Plans and maps share a visual system called “ichnography” or simply “plan view,” a shorthand that represents every point as if the viewer is directly above it, looking down. Of course, in any real aerial view, only one point is seen this way, with all others seen at an oblique angle that increases with distance. Plan view is all-seeing, god-like, but also deceptive and illusory. Keeping the viewer at a comfortable distance, it hides not only the third dimension but the dynamic, temporal and sensual qualities of place.
Figure 2: Renaissance ideal cities inspired by Vitruvius (15th-16th c.) 1. Filarete, 2. Fra Giocondo, 3. Girolamo Maggi, 4. Giorgio Vasari, 5. Antonio Lupicini, 6. Daniele Barbaro, 7. Pietro Cattaneo, 8/9 di Giorgio Martini.
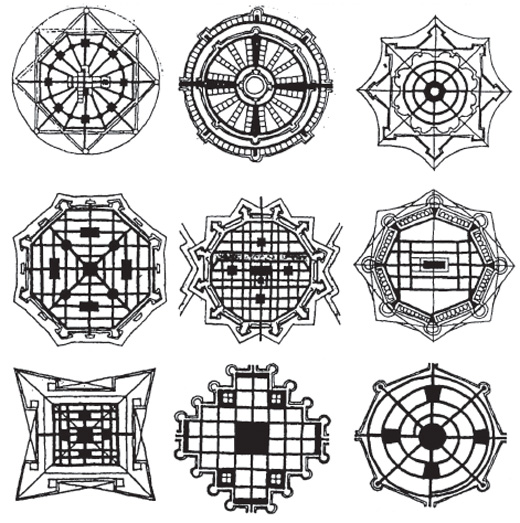
Courtesy of Marten Kuilman
Utopian Templates
Periods of great social and cultural upheaval have often produced upsurges of utopian thinking. To a surprising degree, ideal societies come with a recipe for good urban form, embodying the values of their proponents and colored by the anxieties of their circumstance.
In Renaissance Italy, artists and designers joined in the broader humanistic assertion that society could and should be shaped by human ideals. Hemmed in by the tangled, narrow medieval streets around them, they became fascinated with ideal cities, imagining serene and unpopulated spaces, out of time and out of any real place. The tools of perspective and the development of abstract rules of proportion and symmetry made space itself an object of study.
Renaissance ideal cities reveal a few of the fundamental powers — and also some of the shortcomings — of planning diagrams. First, they are every place and no place, clearly representing urban space in plan view but with no geographical references, and therefore none of the context or constraint that comes with building actual cities. Second, they contribute to a broader discourse about societal ideals and how they might be manifested in the good city. Finally, they provide a kind of formal DNA, a template repeatedly expressed, modified and reproduced both on paper and on the ground.
Sometimes a diagram is meant to be taken quite literally. Such is the case with the Radiant City (p. 8), Le Corbusier’s seminal 1935 statement of modernist, “towers in the park” urbanism. Like Ebenezer Howard’s Garden Cities three decades before it, the Radiant City sought to address the congestion, pollution and disease of the 19th-century industrial city, “inspired by the prospect,” as planning historian Robert Fishman put it, “that a radical reconstruction of the cities would solve not only the urban crisis, but the social crisis as well.”
Figure 3: A contemporary aerial view of the city of Palmanova (1593), an Italian military settlement based on a Vitruvian plan.
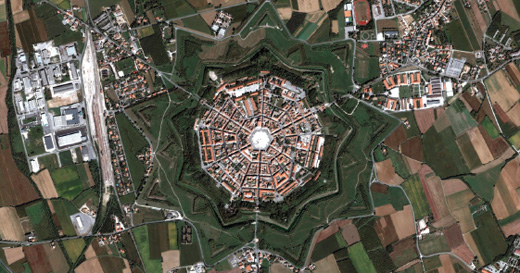
Courtesy of Google Earth
For Le Corbusier, this meant eradicating the dark, tubercular alleys of the old city and replacing them with widely spaced ranks of cruciform towers, ringed with expressways and sorted into separate sectors for commercial, industrial and residential uses. Although one can read the Radiant City as a diagrammatic manifesto of planning principles, it was also a literal architectural proposal, one that was taken up and applied wholesale in a staggering number of locations from the suburbs of Paris to the center of Chicago. Built expressions of this vision are virtually indistinguishable from the utopian scheme, except for the disastrous outcomes of some. The simplicity of the design (the basis of its appeal and aesthetic elegance) is a lot like a diagram, and quite unlike a city.
Other Ways of Looking
Some types of graphics suggest particular ways of looking at a city, and thus lend themselves to particular sorts of insights. For example, in 1909 Patrick Geddes used a “transect,” borrowing the visual language of a cross section from architecture (an imaginary slice through space, viewed from the side) and deploying it as an analytical tool at a much larger scale borrowed from ecological science. The diagram perfectly suited Geddes’s purpose, revealing the way conditions and contexts change across the landscape. Thus, as a way of representing and looking at space, it makes the case for context sensitivity, for a broad consideration of a site’s urban, regional and ecological situation.
Similarly, the figure-ground or Nolli plan (p.16), named for Giambattista Nolli’s masterful 1748 map of Rome, excels at revealing the way in which buildings define streets and open spaces, creating a legible pattern. In the 1960s, critics of the modernist approach to city form used the graphical conventions of the Nolli plan to demonstrate the value of spatial definition and traditional urban patterns.
Quantitative Diagrams
Although city planners and urban policy makers use data and language to assert their arguments, often it is a single image that sticks in the public imagination. Diagrams can be encapsulations of numerical data, like Michael Mann’s “hockey stick graph” of average temperatures over time, whose shocking crystallization of the effects of global climate change helped put climate impacts at the core of planning discourse.
Practical Diagrams
Several of the diagrams presented here are simply planning tools, designed for clarity, not inspiration. They nevertheless have a complex relationship to a specific set of values and assumptions. The urban grid, in use since ancient Greece, has proved the default geometry wherever quick and efficient urban development has been needed, most famously in notoriously impatient Manhattan.
The 1785 federal township and section grid was also basically mechanical but revealing of underlying concerns. The rural grid served to normalize the settlement (or conquest) of the American West but embodied Jeffersonian ideals about small landowning farmers as the backbone of the democratic ideal. After the West had been parceled out, Frank Lloyd Wright would take up the rural grid as the basis of his Broadacre City, a utopian anti-metropolis first presented in 1932, which spread the population across the American interior on one-acre house lots.
In the case of the setback diagram of New York’s 1916 Zoning Resolution, the purpose was to illustrate a new regulatory code. This diagram sketched an ambitious new governmental power — the regulation of not only land use but built form as well. But its most profound innovation was accidental: the deeply evocative profile of skyscraper New York at its midcentury apex.
Anti-Plans
Some diagrams are about resistance. In the early 1960s, the Oakland Tribune published a diagram that traced and greatly simplified an Army Corps of Engineers map projecting the future extent of fill in San Francisco Bay if historic rates of infill continued. The image (shown on page 3), which showed only a pitiful channel remaining in the center of the bay, was captioned “Bay or River?” A perfect expression of the power of diagrams, it became the rallying cry of a movement led by Save the Bay that ushered in powerful new environmental protections.
In the 1950s, a group of radical scholars, artists and architects in Europe that called themselves the Situationist International grew increasingly alarmed at the rationalist urban renewal schemes of modernist architects. The city, they argued, was constituted from the bottom up by the experiences of individuals. They cultivated resistance to the soullessness of the modern city through play, serendipity and aimless but open wandering. They coined the term “psychogeography” to describe this personal encounter with urban space, illustrated by evocative maps of the process. This critique of top-down planning would be taken up by resistance movements around the world — led by Jane Jacobs and others — who turned back freeways and bulldozers and dared to question the authority of the experts. It would also lay the foundation for a new culture, now in full flower, of omnivorous delight at the experience of city life.
Planning Ahead
A critical examination of the assumptions and narratives of planning as a discipline is an essential aspect of responsible practice and informed citizenship. It reveals something of the fascinating historic relationship between values, ideologies and planning practice, mediated in this case by visualization. But, more important, it calls us to examine our own assumptions and ideals about cities and the ways in which we shape, imagine and represent them.
[1] Garden Cities
In 1902, Ebenezer Howard, an unassuming stenographer and amateur inventor, published one of the most influential visions in the history of city planning, called Garden Cities of To-morrow. In it, Howard created a series of diagrams that helped to establish the orthodoxy of 20th-century city planning. The crisis behind what Howard called the “Garden City idea” — the pollution and overcrowding of the industrial city — is encapsulated in one diagram’s title: “A Group of Smokeless, Slumless Cities.”
Figure 4: One of a series of diagrams by Ebenezer Howard, “A Group of Smokeless, Slumless Cities” encapsulated the pollution and overcrowding of the early 20th century industrial city.
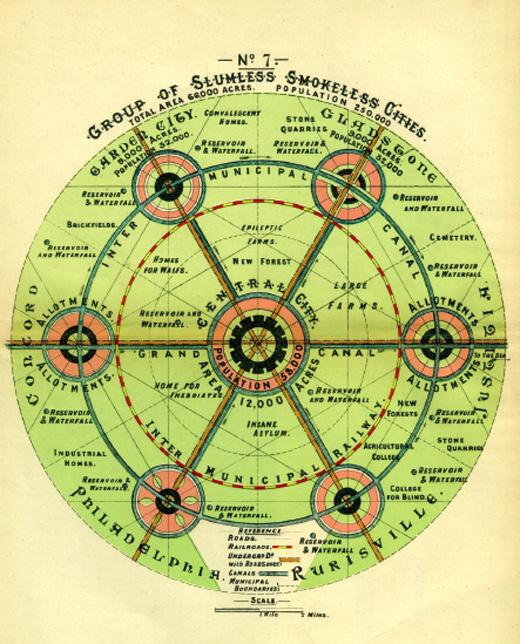
Howard proposed decentralizing industrial cities by constructing a regionally coordinated series of smaller Garden Cities in the countryside. Linked by railroads and canals and separated by a permanent greenbelt, the Garden Cities would offer the best of both town and country life to their 32,000 residents, including employment in factories and workshops, affordable rents and abundant open space. The Garden City was predicated on a quietly radical program of economic reform, in which cooperative associations would own the land and lease it to tenants, reinvesting the proceeds in public improvements.
It is hard not to read Howard’s compelling circular diagrams as plans, though they pointedly claim not to be. The Garden Cities seemed to emerge as fully formed (and quaintly named) satellites, their utopian English landscape awash in progressive social institutions (like “homes for waifs”) and productive rural enterprises. Nearly a century later, the graphic treatment of circular pearls on a string of transit infrastructure would be picked up by planners advocating transit-oriented development.
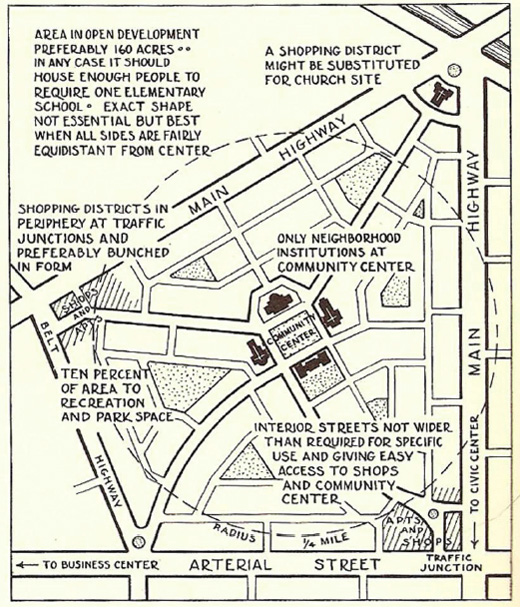
Although Howard and his followers initiated two Garden Cities, Letchworth and Wellwyn, the industrial and collectivist aspects of the effort languished. But the spatial concept of comprehensively planned decentralization through the establishment of new towns of a more humanizing scale and character was profoundly influential, and Howard’s diagrams are widely admired to this day. In the 1920s, Howard’s idea found an enthusiastic reception in the Regional Planning Association of America, which was looking for ways to address congestion in the New York area. RPA leaders including Lewis Mumford, Clarence Stein and Clarence Perry, adopted the idea of decentralization through planned communities in permanent greenbelts.
Figure 5: The American Garden City: Clarence Perry’s “neighborhood unit” (1929) reshaped Howard’s vision for the private car.
[2] The Towers in the Park
Modernist architects, most famously in the person of Charles-Édouard Jeanneret (known as Le Corbusier), offered quite a different approach to the congestion, disease and pollution of the industrial city. As revered for his masterfully poetic buildings as he is reviled for his grandiose urban planning schemes, Le Corbusier remains a polarizing titan of the 20th century.
Beginning in the 1920s, Le Corbusier developed a series of rationalist ideal cities, which he claimed would solve urban problems through the application of scientific methods by powerful cadres of experts. Working with CIAM (In French, “International Congress of Modern Architecture”), he created the Athens Charter, a manifesto for the modern city.
Le Corbusier’s vision of the “Radiant City” (also referred to as “Towers in the Park”) set large slab towers far apart to provide residents with equal access to light, air and open space. The green space in between would be available to all, even passing below buildings that were raised on stilt-like pilotis.
Where the traditional city ran on messy mixture, the Radiant City sought order through separation. Large, pedestrian-only superblocks would be surrounded by expressways with interchanges that eliminated crossings and intersections. Land uses would also be radically compartmentalized, with separate sectors devoted to housing, offices, industry and government.
The Radiant City and the modernist vision it encapsulated had a powerful impact on the planning and building of cities in the 20th century. Its promise of light, air and open space directly addressed the prevailing concerns about crowded urban slums, and its separation and rationalization of both land use and traffic promised to protect people from the threats of pollution and automobiles.
It became the predominant template for public housing and for urban reconstruction schemes in general, including American “slum clearance” efforts under federal urban renewal programs. Public housing projects across the country opened with great fanfare, only to succumb to a grim cocktail of economic isolation, underinvestment and the intrinsic shortcomings of their physical design. Parks became parking lots or grim no-man’s-lands. Basic services were unavailable, and the stigma of being isolated in a separate world compounded structural shifts away from manufacturing that marooned thousands of working-class families in concentrated enclaves. In 1972, just 18 years after their completion, for example, the Pruitt-Igoe projects in St. Louis were dynamited, becoming a symbol of the failures of modernist urbanism.
Figure 6: Le Corbusier’s “Radiant Cities” (1935) were built around large towers set far apart to provide residents with equal access to light, air and open space.
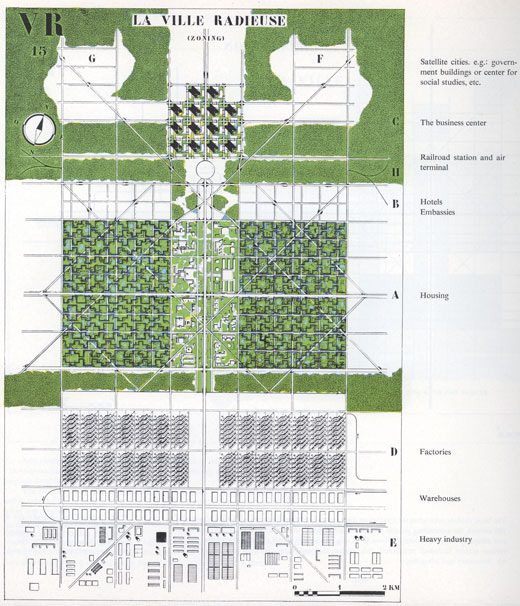
From Le Corbusier’s “The Radiant City” (1933).
Figure 7: In 1947, the Radiant City comes to San Francisco’s Western Addition. Throughout the U.S., Le Corbusier’s ideas provided the design template for “slum clearance,” urban renewal and much of public housing.
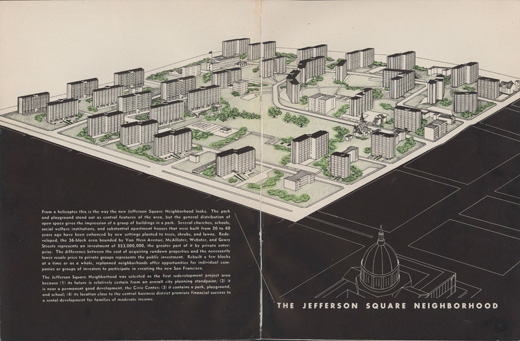
Figure 8: The Public Land Survey System (1785) divided U.S. land west of the Ohio River into “townships” and “sections” on a repeating grid, later shaping settlement patterns.
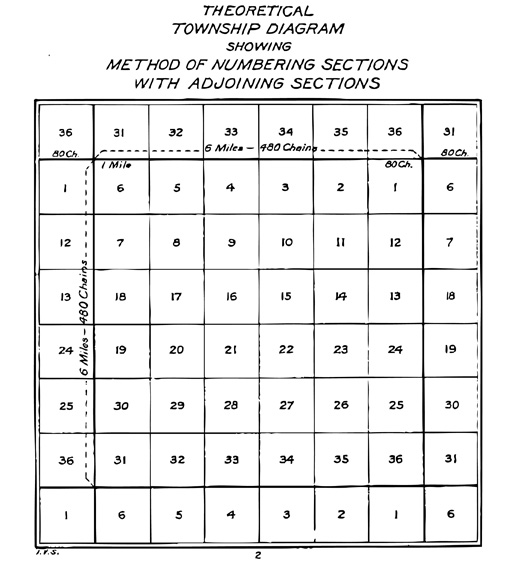
Courtesy United States Bureau of Land Management; Figure 9: Courtesy The Frank Lloyd Wright Foundation Archives (The Museum of Modern Art | Avery Architectural & Fine Arts Library, Columbia University, New York). Frank Lloyd Wright Foundation, Scottsdale, AZ.
[3] The Rural Grid
With the 1785 Land Ordinance, Congress created the Public Land Survey System, in which three-quarters of U.S. land area would ultimately be surveyed, sold and settled. Beginning west of the Ohio River, the system laid a grid of 6-mile-square townships across the country’s midsection, ignoring the natural geography. Each township was composed of 36 one-mile-square sections. It was one of the most influential acts of spatial planning in human history.
The Land Ordinance solved several pressing issues for the young republic. First, it provided a fundraising mechanism for the federal government, which had limited powers of taxation and deep Revolutionary War debt. Second, its simplicity facilitated rapid and orderly settlement of newly conquered territory minimizing conflict over land claims. And third, it helped realize the aspiration of its sponsor, Thomas Jefferson, that the United States should be a nation of small landowning farmers.
Figure 9: Above, a model section of Frank Lloyd Wright’s anti-urban utopia, Broadacre City (1932–59).
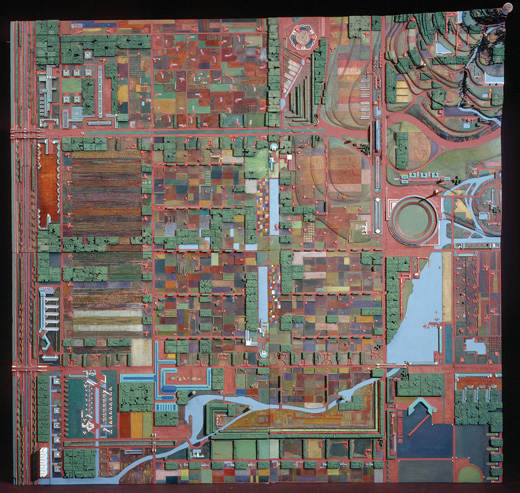
Courtesy the Frank Lloyd Wright Foundation Archives (The Museum of Modern Art | Avery Architectural & Fine Arts Library, Columbia University, New York). Frank Lloyd Wright Foundation, Scottsdale, AZ
The township diagram, repeated thousands of times, established a pattern (what geographers call the “cadaster”) that would shape everything that followed. Farmhouses stood in their square fields, so villages rarely formed. State and county borders were ruler-straight. Roads were placed along parcel boundaries, and urban development occurred in sectional increments, producing the characteristic one-mile grid of arterial streets seen today in cities like Phoenix, Chicago and Las Vegas.
In the early 1930s, Frank Lloyd Wright began work on a utopian scheme called Broadacre City, which was unique in that it was inspired by and built on the dimensions of the township and section grid. By granting each family one-acre and dispersing them across the American interior, the idea was that cities would disappear, to be replaced by a hybrid of Jeffersonian yeomanry and Corbusian social engineering.
[4] The Street Grid
“The heritage of the gridiron plans goes back at least to the Roman camps. The basis for the grid as an enduring and appealing urban form rests on five main characteristics: order and regulatory, orientation in space and to elements, simplicity and ease of navigation, speed of layout, and adaptability to circumstance.” —Patrick Geddes
Figure 10: The 1811 Commissioner’s Plan for Manhattan sought to regularize the city's erratic street patterns by applying a consistent grid.
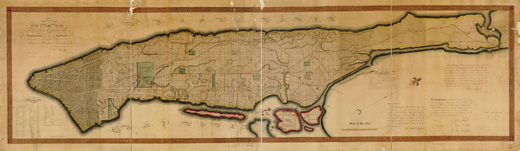
Courtesy of the Geography and Map Division, Library of Congress
The gridiron plan has been used to lay out cities since architect, urban planner and mathematician Hippodamus planned the Greek colony of Miletus around 450 BC. It would reappear throughout urban history whenever cities needed to be built quickly and could be planned in advance. It would recur in China’s ancient imperial capitals, in the military encampments of Roman legions and in the medieval bastides from which Europeans launched their crusades. But its heyday was the Age of Reason, from the late 16th to the early 19th centuries, when rational philosophy, imperial conquest and explosive economic expansion made the grid the default urban pattern in many settings. The grid embodies a rational, Cartesian conception of space, but its chief virtues are its simplicity, scalability and pragmatism. It is easily surveyed and subdivided into regular parcels that are easily built out. It is also modular, so new districts can be added incrementally as a city grows.
The form reached its apotheosis in the 1811 Commissioner’s Plan for New York City, which sought to regularize the development of Manhattan (and its hodgepodge of colliding grids) north of Houston Street. The relentless application of the grid is especially notable for what is omitted: the diagonal of Broadway, which predated the plan and would resist its erasure; the island’s natural topography of hills and rocky outcrops, which would be partially blasted away but survive in places; and of course Central Park, which would be created later, providing a curvaceous Romantic counterpoint to the grid and a real estate bonanza for adjacent properties.
But the grid had its drawbacks, and 19th-century skeptics of its relentless rationality began idealizing the winding streets of the past and injecting curves wherever they could. By the 1950s, huge tracts of suburban cul-de-sacs were being laid out, and the virtues of the grid were forgotten.
Figure 11: San Francisco’s street grids ignored the city’s hills, wetlands, and coastline, all of which are all visible in this 1852 map.
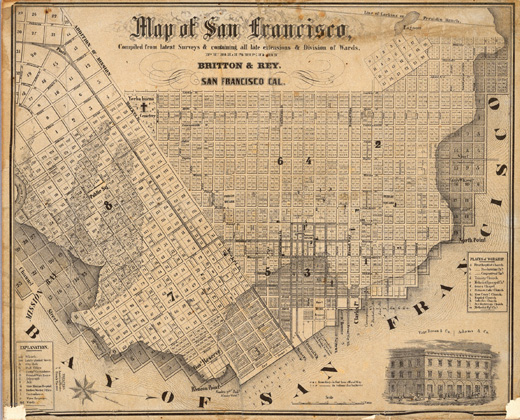
Courtesy of the David Rumsey Map Collection
Figures 12 and 13: The ancient Roman castrum, (at left) a gridded military encampment, became the basis for the plans of later settlements including Florence, Italy (below).
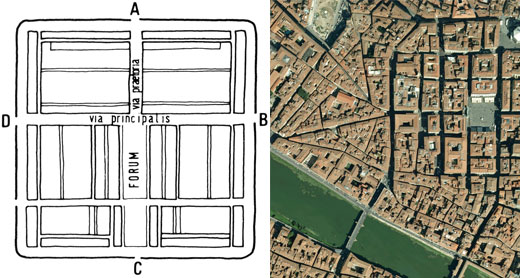
Figure 13 courtesy Google Earth
[5] The Megaregion
Thinking about urban regions has mostly focused on the idea of a center city and its periphery, whether an agricultural hinterland or a ring of bedroom communities. Indeed, the idea that important challenges could — and should — be addressed at the regional scale (the nine-county Bay Area, for example) had by the early 20th century become a major stream of planning thought.
In the 1960s, however, sociologist Jean Gottmann described “a new order in the organization of inhabited space,” emerging at a scale well beyond conventional definitions of the region. His 1961 book, Megalopolis, described an urban agglomeration comprising Boston, New York, Philadelphia, Baltimore and Washington, D.C. that exhibited considerable economic, geographical and cultural integration. The idea proved prescient, as the megalopolis (also known as the “megaregion” or “megapolitan region”) has become an increasingly distinct and pervasive phenomenon of the global age.
Megaregions are loosely integrated urban clusters of 10 million people or more, with an indistinct physical form, containing a wide range of land use and demographic conditions and a complex set of internal economic relationships. No single metric can define a megaregion, but its logic might be revealed in a series of commonalities: overlapping job and housing markets, key industries in common, integrated transportation systems, ecological context and cultural outlook. This new unit brings with it a new imperative: institutional and policy frameworks with a megaregional perspective.
SPUR’s 2007 report, The Northern California Megaregion, describes an area with a core extending out from San Francisco, taking in Sacramento, Modesto, Monterey and Lake Tahoe, and whose sphere of influence includes both Fresno and Reno. It uses a variety of metrics and proposes several policy initiatives to tackle challenges at a megaregional scale.
Figure 14: Jean Gottman’s seminal book Megalopolis (1961) argued that the northeastern U.S. could best be understood as a single, complexly integrated urban megaregion.
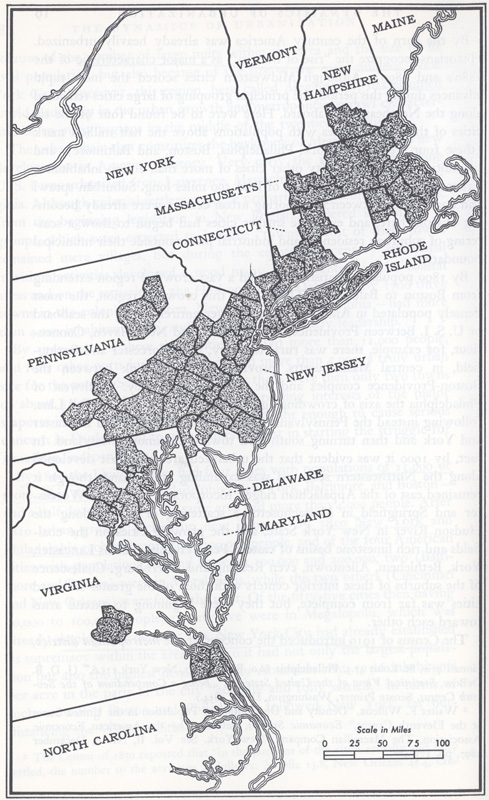
From Jean Gottman’s “Megalopolis” (1957)
Figure 15: In 2009, the Regional Plan Association (RPA) mapped 10 “megaregions” in the United States, where most of the growth in the coming decades is expected to occur.
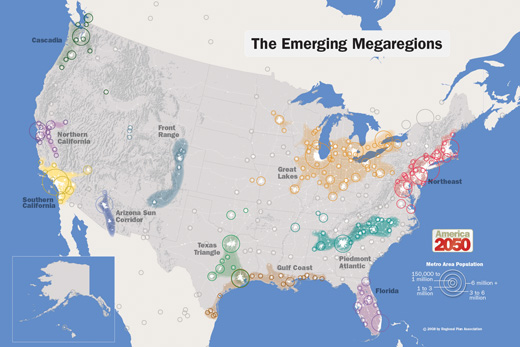
From the Regional Plan Association (RPA)
[6] The Transect
A transect diagram combines the visual language of the architectural cross section with a scale and analytical approach borrowed from the science of ecology. It reveals how conditions change across a landscape, suggesting the importance of context to both natural and built communities.
The technique was deployed more than 200 years ago by Prussian geographer Alexander von Humboldt, who used a transect to diagram the biogeography (the study of the distribution of species, organisms and ecosystems in geographic space and through geological time) of Patagonia from ocean to ocean. In 1909, the Scottish planner and sociologist Patrick Geddes drew his influential “Valley Section” — a transect that showed how ways of life, or “natural occupations,” emerged from their geographical context. His emphasis on extractive industries like hunting and mining notwithstanding, his way of thinking had a profound influence on the regionalism and environmental consciousness that became a powerful force in 20th-century planning. Landscape architect Ian McHarg would also deploy the transect as an analytical tool in his influential 1969 book Design with Nature, which established the framework for today’s ubiquitous use of geographical information systems (GIS).
Figure 16: Patrick Geddes’ 1909 Valley Section demonstrated how ways of life or “natural occupations” such as miner or hunter, emerged from their geographical context.
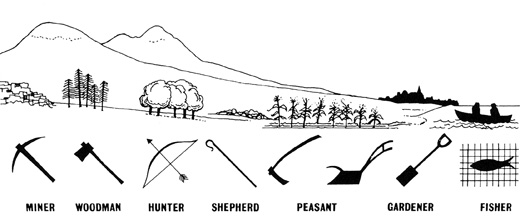
Courtesy of the Center for Applied Transect Studies
Figure 17: In 1999, Andres Duany created the “urban to rural transect,” which identified a series of conditions from the urban core to wild nature, and proposed that planning policies change as densities varied.
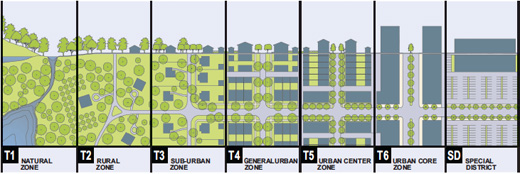
Courtesy of Andres Duany, DPZ
[7] Sculpting Form
Many of the tools of city planning were created in order to regulate the excesses of the 19th-century industrial city, including unregulated development, overcrowded tenements and noxious industrial uses. Like many early planning codes, New York City’s 1916 Zoning Resolution established Euclidean zoning that regulated land use, defining residential, commercial and industrial zones. But unlike many such laws, it also regulated the “building envelope,” or the allowable volume that a structure could occupy. This was in response to previously unregulated steel skyscrapers like the 1914 Equitable Building, which angered its neighbors by blocking light, air and views. The zoning was part of a broader Progressive Era planning agenda that included tenement reform and building fire and safety codes.
Figure 18: Hugh Ferris’s renderings from The Metropolis of Tomorrow (1922) tested the implications of the 1916 zoning law, but also defined a new urban a
esthetic.
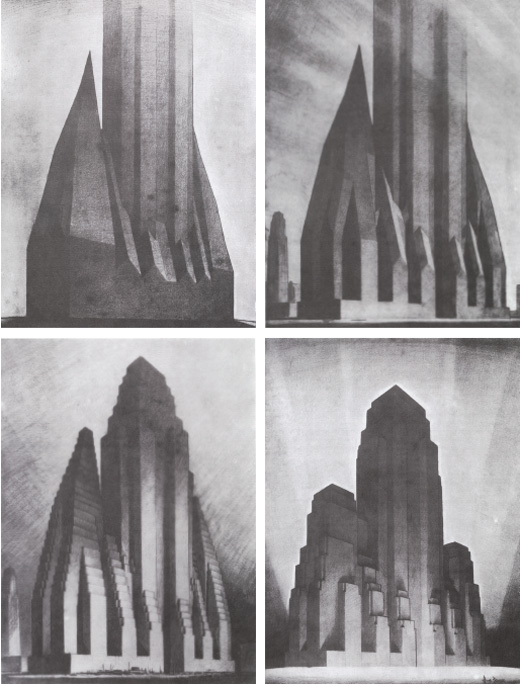
From Hugh Ferris’s “The Metropolis of Tomorrow” (1929)
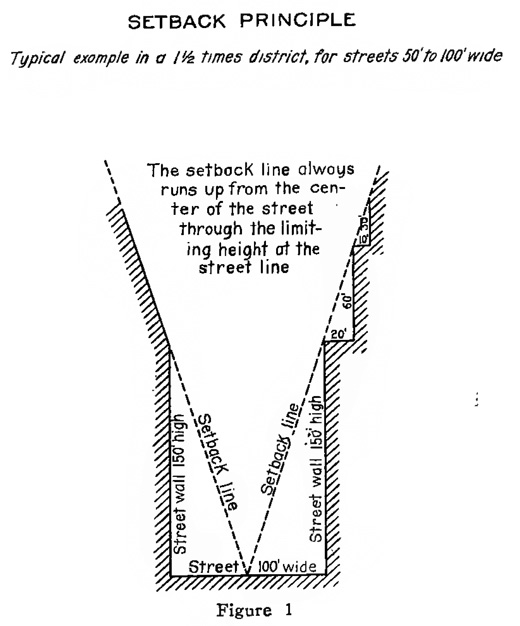
The new law allowed a “street wall” proportional to the width of the adjoining street, above which a building would need to step back and fit within a “sky exposure plane” that would allow at least some light to reach street level. This subtractive approach to urban design was well suited to the intense growth pressures of early-20th-century Manhattan. In 1922, an architectural draftsman named Hugh Ferriss set out to illustrate the implications of the new law. His moody charcoal renderings were eerily predictive of the Manhattan that would emerge in the subsequent decades, a machine-age metropolis that would populate countless comic books and films.
The approach to regulating built form would become part of the toolkit of city planning. San Francisco’s 1985 Downtown Plan included both tower setback and height limits (later superseded by Proposition K shadow regulations) to ensure that the sun reached open spaces.
Figure 19: In this aerial view of New York City, the impact of the resolution on built form is clearly visible by the 1930s.
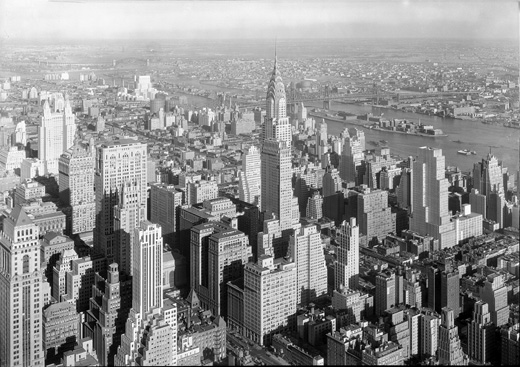
Figure 20: The 1916 Zoning Resolution setback principle regulated land use and defined commercial, residential and industrial zones with New York City.
[8] The Nolli Map
Giambattista Nolli’s 1748 map of Rome was a major milestone in cartography. It presented the entire city to scale in plan (or “ichnographic”) view — with every point seen as if from directly above. At the time, most urban views were imagined bird’s-eye aerial perspectives that were not technically rigorous.
The Nolli map’s impact on urban design and planning stems from its graphical convention: In figure ground diagrams, buildings are shown as dark masses, with streets and open space left white. The effect — now a common analytical technique — is to reveal the characteristic pattern of streets and buildings that underlies urban form.
The figure-ground or form-void relationships that these diagrams illustrate proved to be hotly contested in the 20th century. In traditional urban patterns like Nolli’s Rome, streets and open spaces generally read as the foreground, defined and shaped like urban rooms by background buildings. Modern architects inverted this relationship, with buildings as foreground objects, set in background space, which tended to be poorly defined. Beginning in the 1970s, urban designers like Colin Rowe turned to figure-ground maps to illustrate the qualities that were being lost, and to make the case for traditional patterns.
Figure 21: Giambattisti Nolli’s 1748 map of Rome (Nuova Pianta Di Roma) presented the entire city to scale, with every point seen as if from directly above.
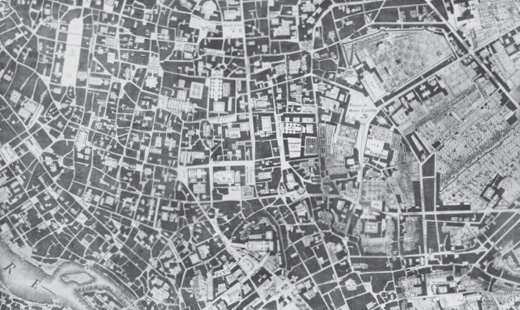
Courtesy of the University of California Berkeley Library
Figures 22: Allan Jacobs’ seminal treatise Great Streets (1993) takes figure-ground analysis to a new level, showing 50 one-mile-square maps of cities around the world, all drawn to the same scale. Four examples are seen at right.
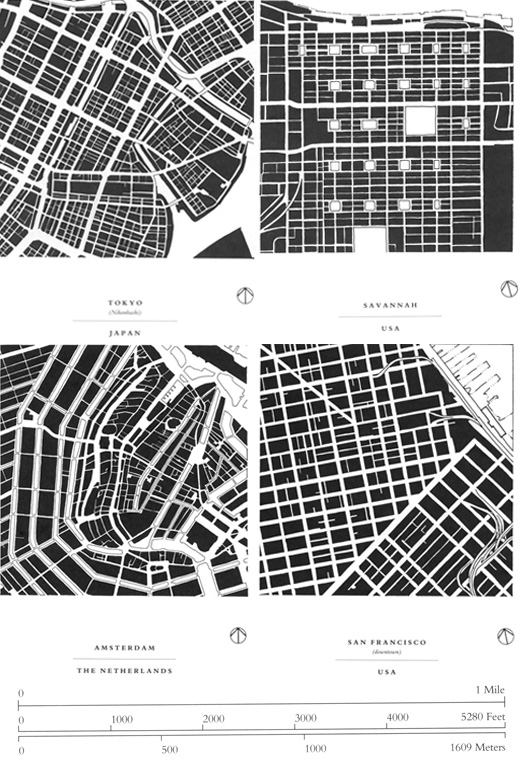
From Allan Jacob’s “Great Streets” (1993)
[9] The Bottom-Up City
In the 1950s, the Situationist International, a group of radical scholars, artists and architects in Europe, had grown increasingly alarmed at the rationalist urban renewal schemes of modernist architects. Ancient quartiers were being demolished and replaced with clean, ordered institutional buildings. Though the Situationists sympathized with the radical social agenda espoused by modernism, they felt that the soulful particularities of the cities they loved and the bohemian demimondes they occupied were threatened by the cold absolutism of modernism. They set out to confound and resist not only the excesses of bourgeois capitalism but also the tyranny of modernism’s urban form agenda, however progressive its motives.
Figure 23: Theorist Guy Debord’s 1957 Guide Psychogeographique de Paris records one observer’s “drift” though the atmospheres and emotions of Paris.
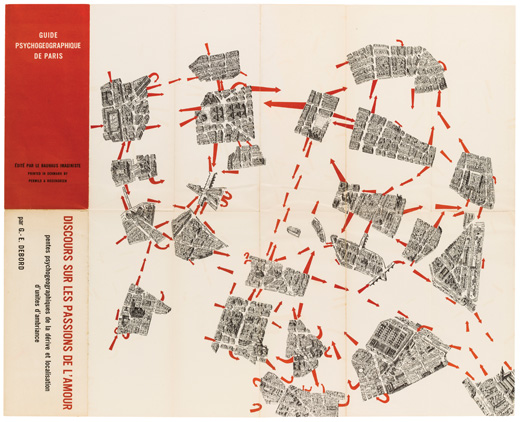
Guy Debord’s Guide Psychogeographique Rijksbureau voor Kunsthistorische Documentatie (RKD)
The Situationists urged a different sort of resistance, one that happened through play, serendipity and of being deeply attuned to the experiential qualities of the city. They coined the term “psychogeography” to get at the way in which the city was created not by architects and planners but rather by the sum of individual experience and meaning. For them, to encounter the city was to create the city. Guy Debord’s “Guide psychogéographique de Paris” diagrammed one particular set of wanderings through the city, its route snipped from a favorite illustrative map.
The idea that the city was constituted through the experiences of its residents also emerged in planning practice as an analytical strain of urban design, one that sought new ways to understand the nuances of city life. Kevin Lynch from the Massachusetts Institute of Technology developed a system of “cognitive mapping” in which subjects mapped the city from memory. The results from a sizable sample could be aggregated, revealing a city’s most memorable or “imageable” features. This newfound emphasis on the experience and memory of urban residents was part of a major reorientation of city planning away from topdown transformation and toward a more contextual, citizen-based approach.
The Situationist emphasis on experiment, play and happenstance has found a new voice in the 21stcentury public realm. Often described as “tactical urbanism,” urban interventions like PARK(ing) Day, Critical Mass, Sunday Streets and Burning Man have blurred the lines between art, play and activism, each taking the city and its possibilities as its subject and each asserting the value of the ephemeral and the experimental in today’s civic discourse.
Figure 24: The “city image” of Boston was compiled and created by Kevin Lynch from the input of many individuals in “The Image of the City” (1961).
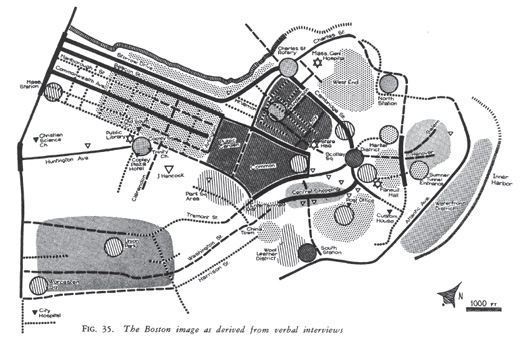
From Kevin Lynch, “The Image of the City” (1960); Figure 25: From Rebecca Solnit’s “Infinite City,” University of California Press
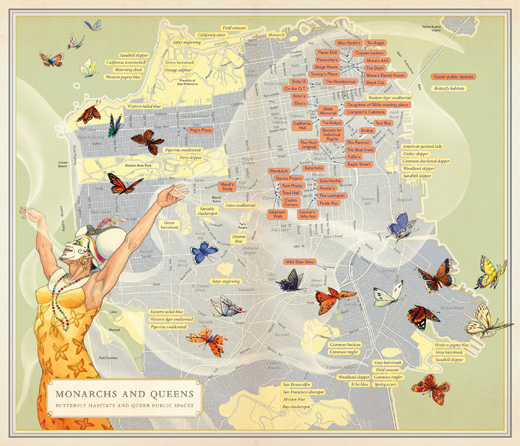
Figure 25: In “Infinite City: A San Francisco Atlas,” (2010) writer Rebecca Solnit created unique portraits of San Francisco from scores of thematic (and imaginary) maps like this one, “Monarchs and Queens.”
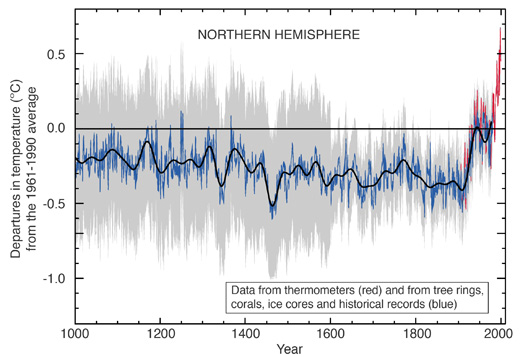
[10] The Hockey Stick
While most of the diagrams featured here were created by planners and architects, few have had as much impact on the practice and rationale of planning as Michael Mann’s “hockey stick,” which combines several sources of proxy data (like ice cores and tree rings) with recent records to show a dramatic spike in Northern Hemisphere temperatures in the industrial era. Nicknamed for its shape, this graph was famously featured in Al Gore’s An Inconvenient Truth, and although it has come under scrutiny by climate skeptics, its scientific validity has been repeatedly confirmed.
The specter of global climate change and the role human settlements play in it has become a central organizing idea in planning and architecture. Simply put, people who live in cities consume less energy and emit less carbon per capita than their suburban counterparts. The fundamental efficiencies of cities — walkability, transit access, smaller homes, fewer cars and more efficient infrastructure — make them a critical tool for lessening our climate impact. The shape and location of growth thus become critical factors in our climate future. Denser growth, well integrated with transit and other amenities, helps reduce our climate footprint, and dispersed, uncoordinated growth worsens it. Many other factors — like public health, civic life, open space preservation and more equitable access to basic amenities (like parks and transit) — also benefit from this kind of “smart growth,” and planners often link the climate argument to other priorities.
This argument is reflected in policies like California’s Senate Bill 375, passed in 2009, which attempts to improve the integration of transportation and land use decisions by tying transportation dollars to more sustainable growth patterns. It is in the process of being implemented and its impact remains to be seen.
Figure 26: Michael Mann’s seminal (and controversial) “hockey stick” graph was one of the first to show how Earth’s temperatures have been increasing rapidly in recent times.
Courtesy of Michael Mann
Figure 27: The shape and location of growth are critical factors in our climate future. As this Metropolitan Transportation Commission map reveals, most Bay Area growth is occurring in car-dependent suburban areas at the region’s edges.
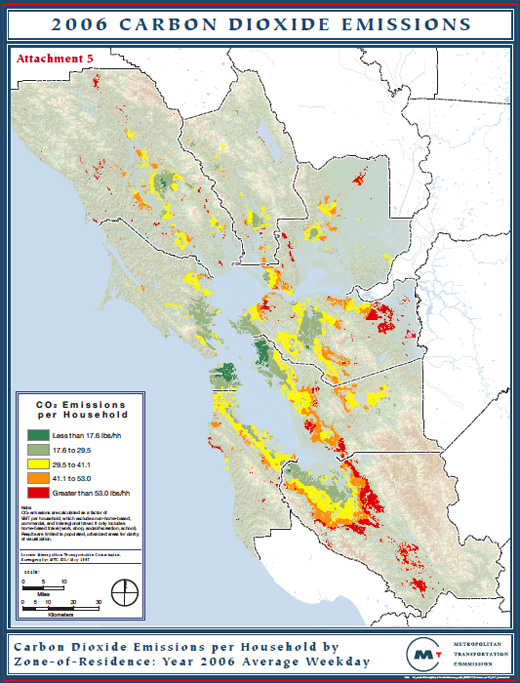
Courtesy Metropolitan Transportation Commission