This article is the second in a three-part series examining San Francisco’s increasing structural deficit and the difficult decisions required to close it. Part 1 looked at the budget process.
San Francisco’s budget is more than a fiscal plan — it’s a reflection of the city’s values, priorities, and longstanding policy decisions. With projected revenues of $15.9 billion for fiscal year 2024–25, the budget is shaped by both revenue sources and the constraints on how funds can be spent. A growing share of revenue is restricted by state and federal mandates, voter-approved set-asides, and legal obligations tied to enterprise departments, leaving only a small portion of the budget truly discretionary. Meanwhile, revenue sources like property and business taxes have become increasingly volatile in the post-COVID 19 era, making fiscal planning more complex and uncertain. In this article, we take a deep dive into the city’s revenues and expenditures and the constraints imposed on them.
Where Do the City’s Revenues Come From?
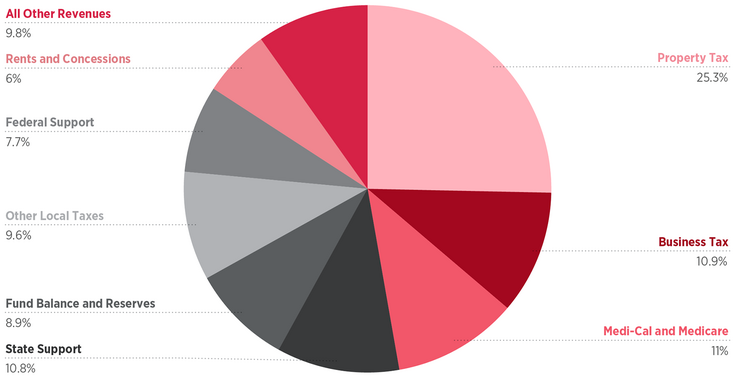
The City and County of San Francisco’s total projected revenues for FY 2024–25 were $15.9 billion. The city collects revenues through taxes; the biggest contributors are property taxes, business taxes, and local taxes. Other sources of revenue include charges for services, state and federal grants, and rents.
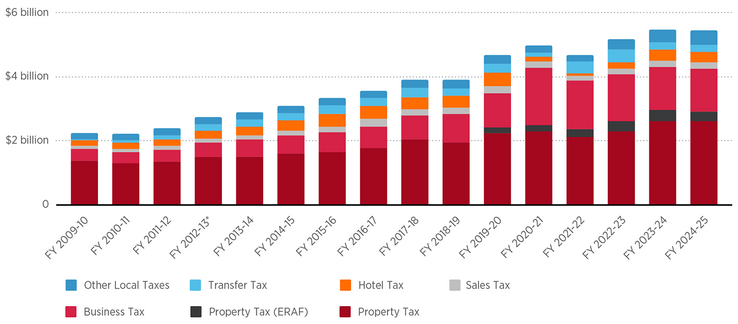
About Half of the City’s Revenues Come From Taxes
Two of the biggest revenue sources, property taxes and business taxes, are increasingly volatile in the wake of the COVID 19 pandemic, making revenue forecasts harder to predict.
Fund Sources Determine How Funds Can Be Spent
The city’s revenue is allocated to either the General Fund or to enterprise departments. Enterprise departments such as the San Francisco International Airport, the San Francisco Public Utilities Commission, the Port of San Francisco, and the Municipal Transportation Agency generate revenues that are legally dedicated to their respective departments to fund their operations. For example, water and sewer payments fund the operations of the San Francisco Public Utilities Commission and landing fees fund operations at the San Francisco International Airport.
Certain revenues within the General Fund are also restricted to specific purposes, including most state and federal grants and charges for certain services, such as planning and building fees. Local tax revenues such as property tax and business tax payments are generally unrestricted discretionary funds and can be used to fund what the city deems necessary. However, voter-approved baselines and set-aside mandates (discussed below) draw from these revenues, decreasing the share of truly discretionary revenues to only 18% of the FY 2024–25 budget.
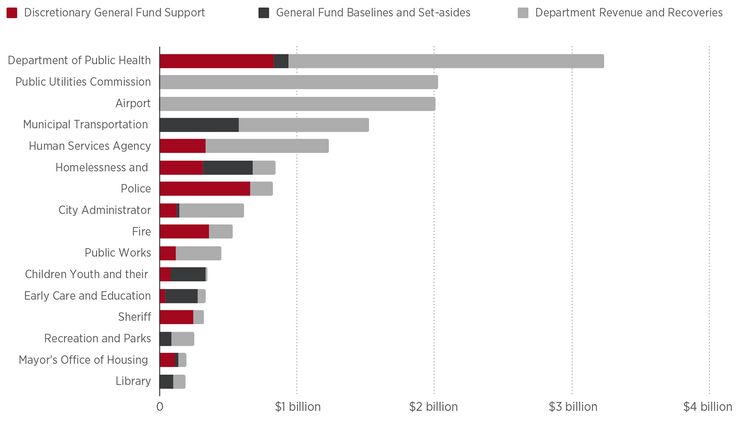
Departments such as the Public Utilities Commission and the airport are completely self-sufficient. The money that they bring in supports their operations. Public safety departments rely mostly on discretionary General Funds that are allocated through the budget. The four largest public safety departments received $1.3 billion, or 47% of all discretionary General Fund sources. Community services such as the Municipal Transportation Agency, libraries, and parks have voter-approved baselines and set-asides that fund a portion of their programs and services.
Only 18% of the FY 2024–25 Budget Is Truly Discretionary
Although the city can use property tax and business tax payments to fund projects and services it deems necessary, voter-approved baselines and set-aside mandates draw from these revenues, decreasing the share of truly discretionary revenues.
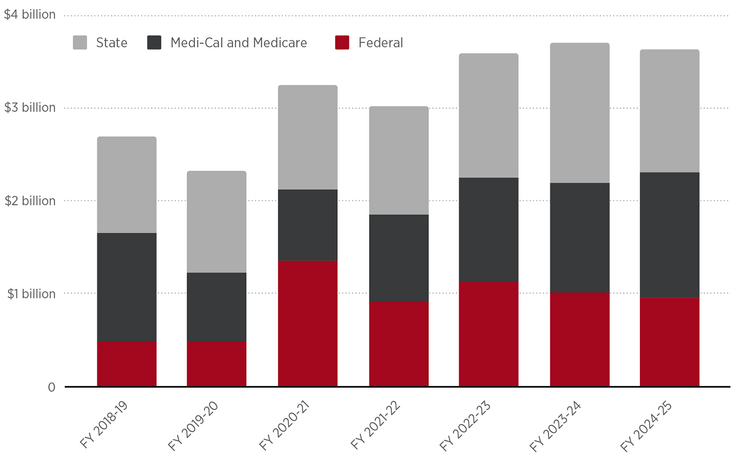
Additional constraints come from spending mandates and restrictions imposed by grants that the city receives from the State of California and the federal government. For example, in FY 2024–25, the city received $200 million from the state to fund the work of San Francisco’s In-Home Supportive Services, which provides support to older adults and people with disabilities. These funds must be used for their intended purpose and cannot be reallocated to fill a gap in service somewhere else in the budget.
State and Federal Grants, About 20% of the FY 2024–25 Budget, Are Restricted to Their Intended Purpose
These grants cannot be reallocated to fill service gaps in the city’s budget.
Finally, the voters of San Francisco have approved a number of mandatory baselines for and set-asides of General Fund revenues. Baselines are generally expenditure requirements that bind the city to spend a certain amount on a specific set of services. Set-asides dedicate certain amounts or percentages of General Fund revenue to a specific service area. Many of these baselines and set-asides include formulas that allow some reduction in dedicated baseline funds during severe deficit years, but in most cases, the General Fund revenue is locked in, limiting the mayor and Board of Supervisors from deciding what to do with these funds.
Budget Set-Asides, Totaling $1.9 Billion in FY 2024–25, Are Another Constraint on Discretionary Spending
While revenues that are generated through enterprise departments cannot be used to support the General Fund, revenues that come into the General Fund can be used to support those departments. For example, in the FY 2024–25 budget, $578 million was allocated to the Municipal Transportation Agency from the General Fund in accordance with voter-mandated baselines.
| Financial baseline | Set-aside amount |
| Children’s Services | $635 million |
| Municipal Transportation Agency | $558 million |
| Library Preservation Fund | $183 million |
| Recreation and Parks | $164.5 million |
| Other Financial Baselines | $380 million |
| Total | $1.9 billion |
Source: Adapted from “Table 7: Projected Baselines. Set-asides and Other Mandated Costs, FY 2024–25 through FY 2029–30,” Proposed Five-Year Financial Plan Fiscal Years 2025-26 through 2029-30.
As the voters have added additional spending mandates to the City Charter, discretionary funds have become more and more limited, leaving policymakers with fewer available choices in balancing the budget. Voter-approved baselines and set-asides have taken a growing share of the city’s financial resources. By 2028 more than 30% of the General Fund will be dedicated to various voter-mandated programs, up from 14% in 1995.
Revenue Sources Evolve
The least-restrictive local revenues are primarily generated through taxes. Property taxes, real estate transfer taxes, and business taxes are the largest such contributors to the city’s General Fund. These taxes fluctuate based on market conditions. Their volatility in post-COVID years has made balancing the city’s General Fund budget very challenging.
Taxes, the Least-Restrictive Local Revenues, Fluctuate With Market Conditions
Property taxes, real estate transfer taxes, and business taxes have generally grown, but not always, as in FY 2021–22, the height of the COVID-19 pandemic.
Property Tax
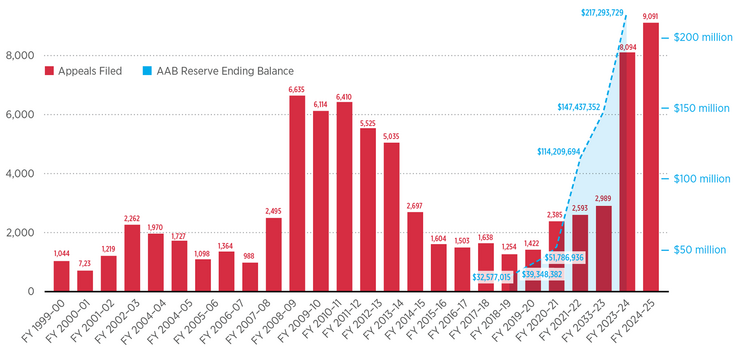
Between 2010 and 2020, property tax revenue grew 103% from $1.3 billion in FY 2010–2011 to $2.6 billion in FY 2020–2021. However, since the COVID-19 pandemic, the city has seen a dramatic increase in property tax appeals as property owners, primarily of commercial buildings, dispute the value of their property given the downturn in economic activity. Currently, more than 9,000 appeals are pending, an increase of 539% in just five years. More than $217 million is being reserved to pay for these appeals.
Property Tax Appeals of (Primarily Commercial) Properties Are Up 539% from FY 2018–19
Property tax appeals have skyrocketed as property owners dispute the value of their property given the pandemic-related downturn in economic activity. More than 9,000 appeals are pending.
Real Estate Transfer Tax
While not as large a revenue source as the property tax, the property transfer tax is a major tax revenue source. The transfer tax rate has been increased by voters multiple times over the last decade and is much more volatile than the property tax rate. The transfer tax is generated on the transfer of a single property. Because the transfer tax is not paid on an annual basis and because a single high-value property transfer can have a significant impact on revenue generation, it’s volatile and difficult to project.
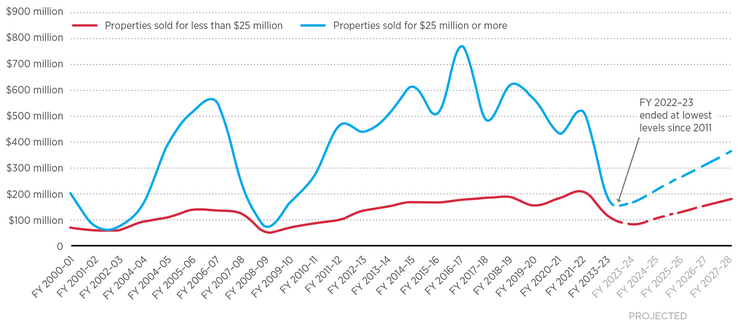
Sales of Properties Valued Greater Than $25 Million Can Significantly Increase Tax Revenue in a Given Year
Sales of properties under $25 million have remained relatively steady since FY 2000–01. Sales of properties valued in excess of $25 million generate significant transfer tax revenue for the city. But these sales are much more volatile and can significantly decrease revenue during economic downturns.
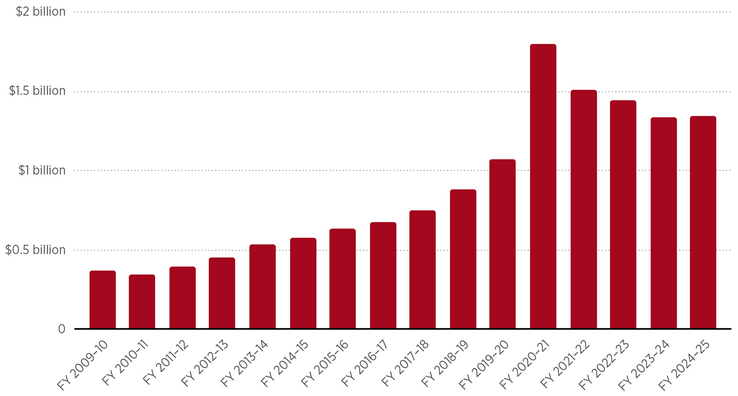
Business License Tax
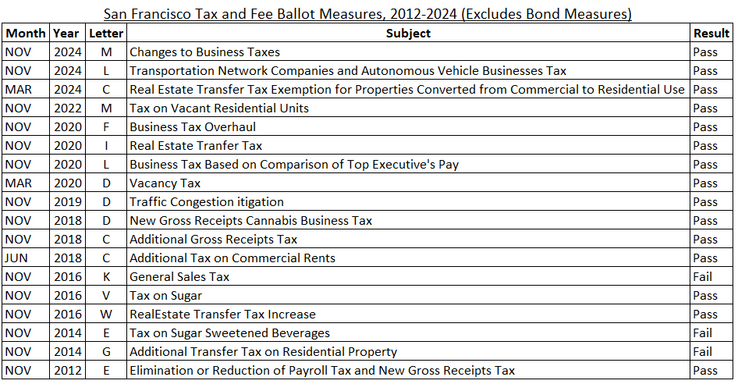
Business tax, like transfer tax, has been amended by the voters many times over the past 20 years. Most recently, in 2024, voters approved Proposition M, reforming San Francisco’s business tax with the goals of increasing the city’s economic resilience, adapting to post-COVID hybrid work patterns, creating more transparency for taxpayers, and helping small businesses.
Voters Amended the Business Tax 18 Times Between 2012 and 2024
The last change in part was aimed at adapting to post-COVID hybrid work patterns.
During the pre-COVID decade, business tax revenue was one of the largest drivers of the city’s revenue growth. It increased 424% from $373 million in FY 2009–10 to more than $1.5 billion in FY 2021–22. This growth resulted from changes to existing formulas and the addition of new business taxes, as well as to the city’s soaring economic growth. But since the onset of COVID-19, the growth trend has reversed. Despite two measures approved in November 2020 designed to increase business tax revenue, that revenue has decreased 11% since FY 2021–22.
Business Tax Revenue Has Decreased 11% Since FY 2021–22
Business tax revenue rose steadily from FY 2009–10 to FY 2020–21, until the COVID-19 pandemic reversed the growth trend. The large spike in FY 2020–21 is largely attributed to the release of prior-year tax revenues from litigation reserves.
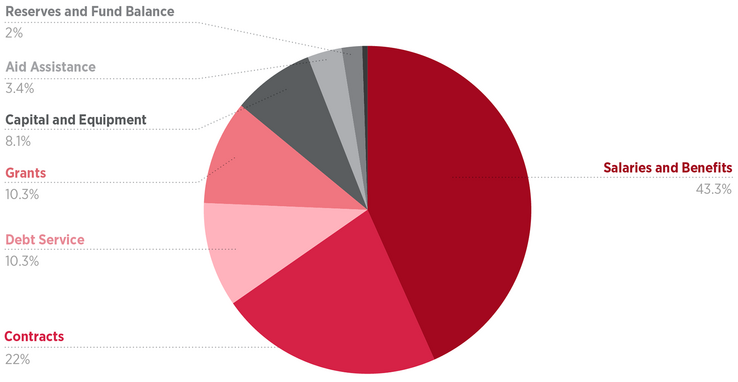
Where Does the City’s Money Go?
San Francisco spends money in two main categories: contracts and staff. Grants and contracts for non-personnel services and supplies account for approximately one-third of the overall budget while salaries and benefits represent 43% of the budget.
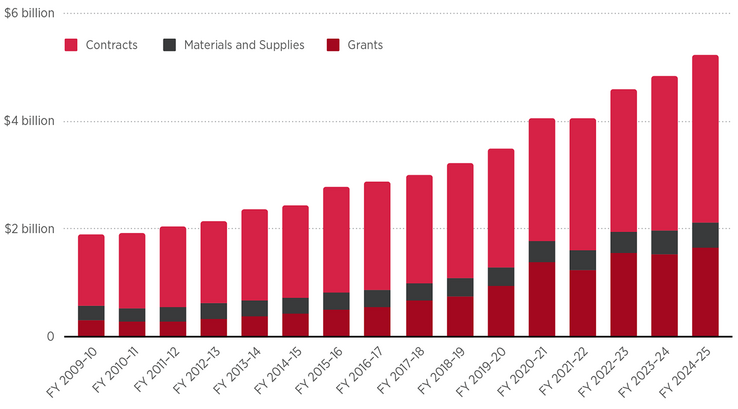
One in Every Three Dollars Goes to Contracts With Outside Entities
As discussed in SPUR’s recently released report Purchasing Power, contractors play a central role in the delivery of city services. The city relies on contractors to design and maintain infrastructure and provide vital public services, including childcare, afterschool programming, substance use prevention, supportive housing, mental health counseling, and services to the elderly. Vendors provide technology platforms, light rail vehicles, office furniture, and so on.
The city has consistently budgeted approximately one-third of its total expenditures for contracts, materials and supplies, and grants. In the current fiscal year, about 23% of the city’s FY 2024–25 budget of $15.9 billion is for contracts and 10% is for grants. Together these expenditures total more than $5 billion appropriated to contracts with external agencies.
One-Third of the Budget Pays for Contracted Services
The city relies on contractors to design and maintain infrastructure and provide vital public services. Although the costs of these services has risen steadily, the portion of expenditures for them has consistently remained at one-third of the annual budget.
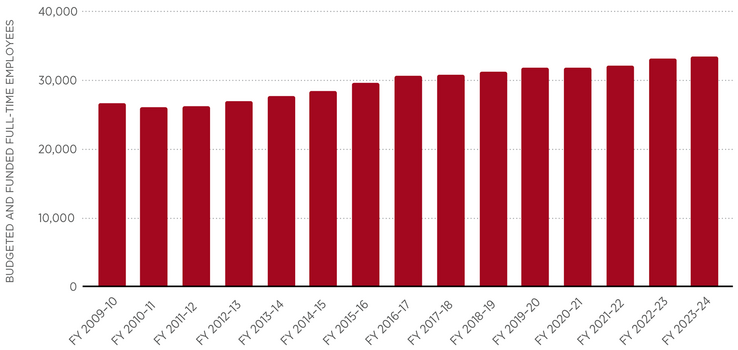
Most of the Budget Goes to Staff
The cost of employees is directly related to how many people the city employs, their salaries, and the cost of fringe benefits that are provided to them, particularly for health and pension benefits.
Over the past 15 years, budgeted spending on personnel expenditures has increased by 100% while the number of staff has increased by only 25%.
Staff Costs Have Doubled But the Number of Staff Has Increased by Only 25%
Staff cost increases are driven by contractual wage increases and rising costs of health and pension benefits.
Wage increases and most terms of employment are negotiated by the city and employee unions through a labor negotiation process, which is defined in the City Charter and by state law. The Mayor’s Office represents the city in these negotiations and presents proposed contracts to the Board of Supervisors for approval only (not further negotiation). Currently, city contracts with the employee unions are closed, which means that current wage increases have already been promised for the upcoming fiscal year and are included in the projections that the city is using to determine the FY 2025–26 budget. The city’s contracts with the police and firefighter unions expire on June 30, 2026; the city’s contracts with all other employee unions expire on June 30, 2027.
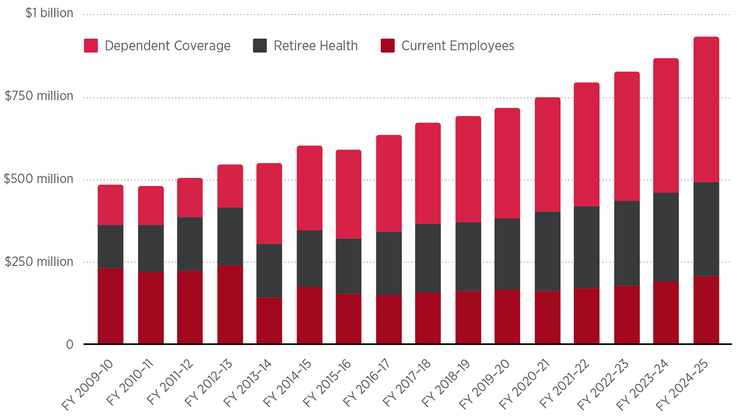
Health Care Costs
San Francisco pays a certain percentage of the total costs of health care benefits to more than 120,000 individuals — current city employees as well as retired employees. The City Charter sets the floor for how much the city must contribute for each employee, retiree, and covered dependent’s health care costs. Additional city payments for these benefits are negotiated with individual unions. Total spending on these health benefits has increased from $487 million to $932 million, or 91%, over the last 15 years.
Health Care Costs Are the Largest Contributor to Rising Staff Costs
Employee health care costs have risen 91% since FY 2009–10.
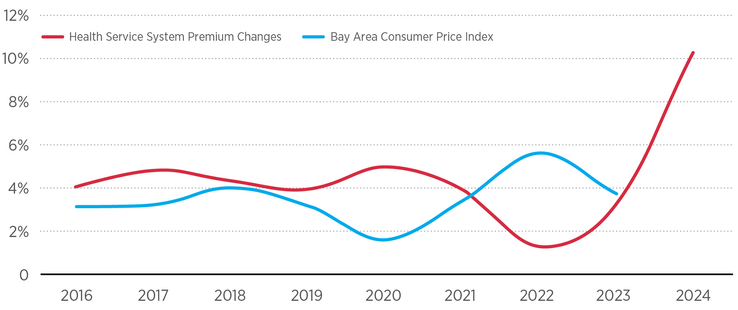
In recent years, health care rates negotiated by the city’s Health Service System have increased significantly faster than Consumer Price Index projections for a variety of reasons, including health care wage and supply cost inflations, increased demand for health services, the costs of chronic conditions, and many other factors impacting the U.S. health system.
Negotiated Health Premium Rates Have Skyrocketed Since 2022
Health care rates negotiated by the city’s Health Service System have increased significantly faster than Consumer Price Index projections.
Pension Costs
Unlike health benefits, pension benefits may not be negotiated or supplemented in employee labor agreements. The only way to change retirement benefits is by amending the City Charter through a ballot measure. For example, last year, voters approved Proposition H, which retroactively changed how pension benefits are calculated for Fire Department staff members hired after 2012 and lowered the age at which these members receive the maximum pension benefits from 58 to 55, costing the city approximately $3.7 million in the first year of the measure’s implementation.
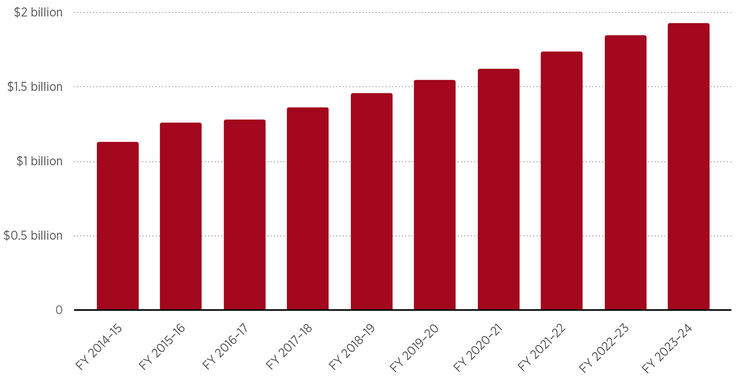
The Charter also mandates that the city fund its pension system, the San Francisco Employee Retirement System (SFERS). SFERS must issue monthly benefit payments to retired employees. These payments are mandated by the Charter, and pursuant to numerous court rulings on pension benefits. They are vested rights of retirees and cannot be changed or reduced once they have been earned. These required payments have been growing year after year as the size of the workforce increases. In the last fiscal year, SFERS paid $1.93 billion in benefits, which is a 71% increase from the $1.13 billion in benefits it paid out 10 years ago.
To keep SFERS funded to pay these mandated monthly benefits, the city must ensure that money in the pension fund is sufficient to keep its pension plans whole. The city does so in three ways:
- It returns income received from retirement fund investments to the system. In FY 2023–24, SFERS earned $2.59 billion in investment returns.
- It makes annual employer contributions to the pension fund. In FY 2023–24, it contributed $672.6 million.
- It requires employees to pay into the pension fund. In FY 2023–24, employees contributed $427.5 million.
Prior to the passage of November 2011’s Proposition C, city employees contributed a set amount (7.5% of their paycheck) to the pension system, regardless of the pension fund’s financial health, and the city contribute whatever amount was necessary to keep the pension system whole. Following passage of Proposition C, city employees began to share in responsibility for the health of the pension fund. Now, rather than simply contributing 7.5% of their paychecks, when the fund’s health is poorer, employees pay up to 13.5% of their paychecks, depending on their job classification and salary, thus defraying some of the city’s costs. When the pension fund is healthier, city employees contribute less than 7.5% of their paycheck.
Since FY 2014–15, San Francisco Employee Retirement System Benefit Payments Have Increased 71%
SFERS must issue monthly benefit payments to retired employees. These payments are mandated by the Charter, and pursuant to numerous court rulings on pension benefits. They are vested rights of retirees and cannot be changed or reduced once they have been earned.
SFERS projects that, over the next decade, the costs associated with pensions are going to remain relatively stable. Neither the city nor its employees will see much of a difference in their contribution rates over that period.
City and City Employee Contribution Rates as a Percentage of Payroll and Salary, Respectively, Are Projected to Remain Stable Over the Next Decade
In FY 2024–25, the city appropriated $681 million to fund the employer’s contribution share. That share could increase if any of the many assumptions underlying the projected stability of contribution rates —including 7.2% annual growth in pension fund investment — proves incorrect.
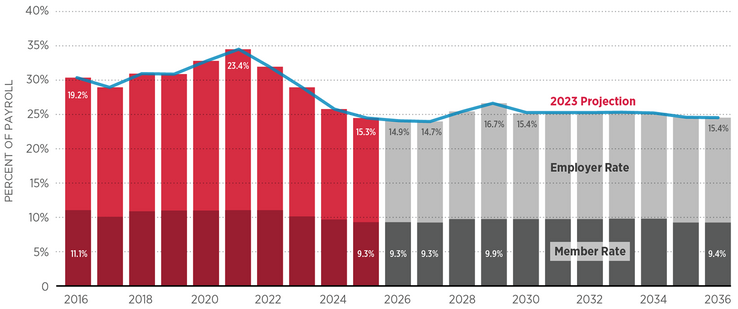
The projected stability in contribution rates reflects many assumptions. Some of the most important assumptions are that the pension system will continue to see 7.2% annual growth in its investments and that the total number of employees and retirees, salary growth for all city employees, and average lifespan of retirees do not deviate from actuarial estimates. If any of these assumptions are wrong, the city’s projected contribution rate will change. For example, should the pension system experience just one bad year and earn less than the 7.2% growth benchmark, the city’s projected costs could increase for years afterward. This reality came to pass in FY 2019–20. Returns that year came in at 2.4%, well under the assumed growth rate. As a result, instead of pension contributions declining significantly, they increased. The projected city contribution in FY 2027–28 alone grew by almost $150 million due to poorer-than-anticipated returns in FY 2019–20. Variance in anticipated returns is a very near-term risk, given the tumultuous behavior of the stock market observed in the first months of the second Trump presidency. As of March 31, 2025, SFERS reports that through the first three-quarters of the fiscal year, SFERS has earned 4.1% less than the expected return of 7.2%.
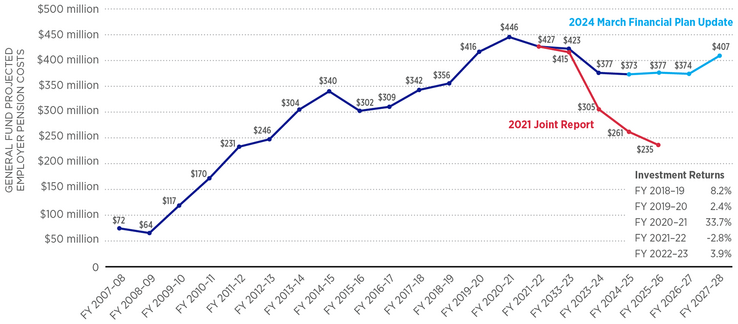
Projection and Actuarial Assumptions Can Miss the Mark Depending on Investment Return
In 2021, SFERS and the controller issued a report projecting reductions (red line) in the city’s pension contribution costs following an exceptional year of investment growth in which SFERS earned 33.7%, far exceeding the 7.2% benchmark. However, after SFERS missed the 7.2% benchmark in two consecutive years, the actuarial projection for the city’s costs (blue line) has increased significantly.
What Happens When Increasingly Limited Budget Flexibility Meets Ever-Growing Needs?
As noted, legal, political, and voter-imposed mandates, along with economic volatility, limit budget flexibility. Nearly half of the General Fund’s discretionary dollars go to public safety and more than $2 billion is dedicated to voter-mandated baselines. With just 18% of the $15.9 billion FY 2024–25 budget considered truly discretionary, city leaders are working within increasingly narrow margins to meet ever-greater needs. At the same time, core revenue sources — property taxes, business taxes, and real estate transfer taxes — have grown more unstable in the post-COVID era, complicating long-term fiscal planning. Rising employee health care costs and pension obligations further strain the budget.
The only way to close the structural deficit is to increase revenues or decrease expenditures. Given the many constraints to the city’s budget, ongoing volatilities of revenue sources, limited reserves, and several state and federal funding sources that are also at risk, this will not be easy. It will require an immense amount of political will, collaboration between decision makers, service providers, and labor, willingness to cut costs, and adherence to sound financial practices, like avoiding use of one-time revenue to pay for ongoing expenditures.
Part 3 of this article series will examine San Francisco’s growing structural deficit and the difficult decisions required to close it.