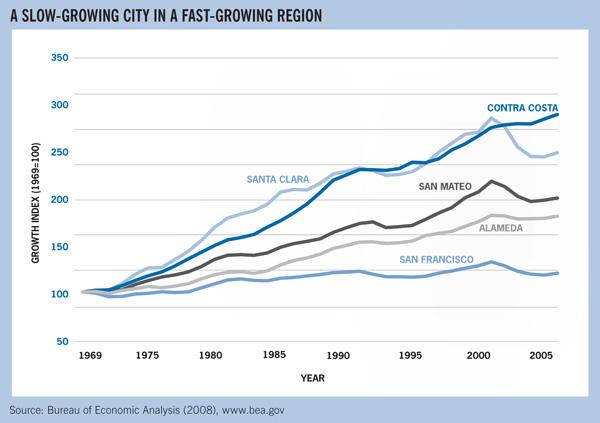
For decades, San Francisco’s employment and population levels have been increasing at far slower rates than the rest of the Bay Area. While in 1972 the city had 27 percent of regional employment, in 2006 it had dropped to 16 percent. Since the 1970s, San Francisco has gained 116,000 jobs, while Santa Clara County has gained nearly six times that amount.1 This trend has resulted in increased job sprawl for the region.
SPUR has long advocated for increasing jobs and housing in existing centers, particularly near to transit. In the Bay Area, transportation accounts for nearly half of the region’s greenhouse gases. By concentrating growth in existing urbanized areas within walking distance of transit, the Bay Area can decrease driving and vehicle ownership in the region, and its negative environmental side-effects.
Environmental tax reform (ETR) is a policy tool San Francisco can use to address both its slow economic growth and its environmental ambitions. ETR decreases taxes on labor or income while simultaneously increasing “green” taxes — taxes on waste and pollution — to discourage environmentally damaging behavior. In San Francisco’s case, a shift away from the payroll tax on businesses towards green taxes on energy, solid waste or transportation can increase economic activity in the city while reducing natural resource consumption and pollution.
In this paper, we explore the idea of reducing taxes on behaviors we want more of — in this case, job creation in the Bay Area’s central city — and replacing the revenue with taxes on things we want less of, in this case behaviors that have a negative environmental impact. The hypothesis tested is whether or not the revenue to the City of San Francisco from its payroll tax (1.5% of payroll over $167,000) could be replaced with a series of green taxes and fees on activities like energy use and driving.
Our analysis shows that it is possible for San Francisco to replace some, but not all, of its revenue from the payroll tax by implementing the green taxes and fees discussed in this report. However, the list of potential new taxes in this paper is not exhaustive. Other green taxes and fees, possibly implemented at the regional or state level, could further replace the revenue generated from the payroll tax, and produce environmental benefits for the city, region and state.
The case for tax shifting
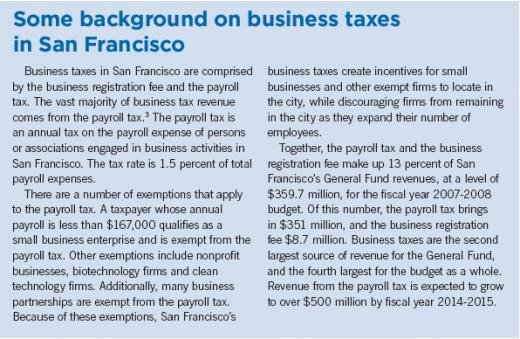
San Francisco’s high payroll tax is an impediment to economic growth, particularly for larger firms that provide the bulk of the middle-income private sector employment. The payroll tax also discourages the expansion and retention of local start-ups, and it factors into the decline of the industrial sector.2
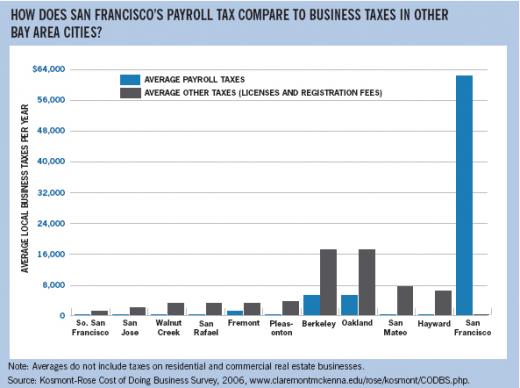
San Francisco’s business taxes are the highest in the Bay Area. The Kosmont-Rose Cost of Doing Business Survey examines tax rates, tax incentives, and development policies in hundreds of California jurisdictions. According to the survey, the average business taxes for a general office firm are $60,500 in San Francisco. For the other key Bay Area cities, San Jose and Oakland, the average business taxes paid by a general firm are $1,806 and $4,800, respectively.
San Francisco is also unusual in that almost all of its business tax revenues (except the business registration fee), come from payroll taxes. The more prevalent types of taxes in other Bay Area cities include a gross receipts tax and a per employee tax.
Although the link between taxes and employment and business location decisions can be ambiguous, recent economic studies have found that taxes do matter. While taxes can be a very low percentage of total business costs, they are an easy expense for businesses to reduce or eliminate by relocating. Modern businesses are very mobile, and nearby cities are often close substitutes for one another. This means that businesses can and do relocate from high-tax to low-tax cities both within and across metro regions. San Francisco and the Bay Area as a region economically compete with similarly situated regions around the world. Research in the past three decades has found that the role of state and local taxes on metropolitan area growth are large enough to make a difference in the policy decisions of businesses looking to move or expand, or of cities and regions looking to promote economic growth.
An analysis of over 80 individual studies on local and state taxes find that, in the long run, taxes do have a significant effect on economic activity.4 Studies that explore interstate and inter-metropolitan growth find that a ten percent decrease in taxes causes a 3.2 percent increase in economic activity. Using this figure, decreasing the payroll tax from 1.5 percent to 1.35 percent would increase measures of business activity by around 3.2 percent.
Businesses require an effective public sector. To succeed, businesses need transportation, planning and public safety. Some call this the “return on taxation,” which is the value that a business places on the quality of public service in the place where they pay the taxes to support the public service. As a result, simply decreasing the payroll tax could economically harm the city by decreasing the level of local revenues and thus public services that firms value. Environmental tax reform that shifts away from the payroll tax to green taxes would preserve revenue levels and allow San Francisco to continue providing the public services that its residents and businesses appreciate.
SPUR has previously studied the question of how the business tax affects business employment decisions. That paper, written by Brian Klinksiek in 2005, concluded the following:
- Taxes play a role in economic development, but it’s not clear how important a role.
- Dozens of non-tax factors also influence firm location decisions.
- It is important for policymakers to understand the complexities of the issue before enacting major changes to the business tax.
Payroll taxes can play an important role in shaping the economic landscape of San Francisco. By decreasing business taxes and shifting towards green taxes, San Francisco can encourage economic growth while maintaining quality public services that businesses value. Furthermore, by concentrating growth in the city, particularly downtown, San Francisco can discourage the movement of jobs into suburban office parks that are poorly served by transit.
Over the past five decades, population growth and job growth have been slow in San
Francisco relative to the region. From 1969-2005, San Francisco’s rate of job growth
has been surpassed by all of its surrounding counties.
Analysis of green taxes and fees
Green taxes and fees increase the price of activities that have harmful environmental impacts. SPUR analyzed three types of potential green taxes and fees that could be implemented in San Francisco: energy, solid waste and transportation. While our list is not exhaustive, we reviewed a wide variety of options.
For each potential tax or fee, we measured the range of potential revenue and quantified the environmental benefit. For example, the benefits of a tax on solid waste can be measured in total tons of waste diverted, while the benefits of a parking tax can be measured in the decreased demand for driving (which is results in lower vehicle miles traveled and/or increases in transit ridership).
The magnitude of environmental benefits hinges on the elasticity of demand for polluting activities — in other words, how individuals or firms will reduce polluting behavior in response to price. The higher the elasticity, the bigger the behavioral shift.
We also analyzed the distribution impacts — who is most affected by the tax — and the secondary economic consequences.
The Way It Is Now
San Francisco currently imposes a Utility Users Tax (UUT) on the non-residential use of telephone services, electricity, natural gas, steam and water. The tax is collected from commercial consumers by service providers, and then paid to the City on a monthly basis. The current rate is 7.5 percent. About 50 percent of the revenue generated by the UUT comes from charges on natural gas, electricity and steam.
What Others Do
Along with Berkeley and Oakland, San Francisco already has the highest commercial UUT in the Bay Area. However, compared to other large cities in California, San Francisco’s UUT is fairly average. According to the City’s Controller’s Office, the highest UUT of all major cities in California is ten percent, imposed by both Los Angeles and Long Beach.
What We Analyze
An annual 2.5 percent increase in the UUT up to three maximum tax levels — ten, 15 and 20 percent — over a 20-year horizon.
Environmental Benefits
The environmental benefits of an increase in the UUT depend on the sensitivity of firms to an increase in the price of energy. A synthesis of studies finds that a ten percent increase in the price of energy will decrease the commercial demand for energy by between five and eight percent in the long run.5 Emissions reduction from an increase in the commercial UUT could range from approximately 12,000 tons of carbon dioxide (ten percent tax) to 72,000 tons (20 percent tax) after ten years.
Revenue Potential
Our analysis shows that the City could generate approximately $11 million in additional revenue in the first year by increasing the UUT to ten percent. This revenue could be used to replace about three precent of total payroll tax revenue. Ultimately, the tax could generate over $30 million if it were raised to 15 percent from the current 7.5 percent.
Secondary Economic and Distribution Impacts
An increase in the UUT will increase the cost of doing business in the city, which will negatively affect energy-intensive industries and may have a negative impact on economic growth.
Conclusion
An increase in the commercial UUT will affect some firms who will not benefit much from a payroll tax decrease. However, payroll costs per dollar of net income are higher for all industries on average than energy costs per dollar of net income. As a result, industries would benefit from a reduction in the payroll tax on average more than energy costs will increase.
From an environmental perspective, an increase in the commercial UUT would produce small but not insignificant decreases in San Francisco’s carbon emissions from buildings. Because the tax is already collected, an increase in the commercial UUT would be easy to administer.
The Way It Is Now
Since 1988, San Francisco has only imposed a UUT on commercial buildings. A residential UUT offers additional revenue-raising capabilities and environmental benefits for San Francisco.
What We Analyze
An annual 2.5 percent increase in the residential UUT up to three maximum tax levels — five percent, ten percent, and 15 percent — over a 20-year horizon.
Environmental Benefits
As with a commercial UUT, the environmental benefits of a residential UUT depend on the decreased demand for energy because of the increase in energy price due to the tax. In the long run, studies of energy consumption find that a ten percent increase in the price of energy causes a four to six percent decrease in the demand for energy. Emissions reduction from reinstating a residential UUT could range from approximately 23,000 tons of carbon dioxide (five percent tax) to nearly 70,000 tons after ten years.
Revenue Potential
Our analysis shows that the City could generate approximately $20 million in additional revenue annually by establishing a residential UUT of five precent. This could be used to replace about three precent of the total payroll tax revenue.
Secondary Economic and Distribution Impacts
A residential UUT raises equity concerns. Such a tax would be regressive, meaning that lower income individuals and households would pay a higher percentage of their income in a residential UUT than those with higher income.
Also, shifting away from a payroll tax, which is ultimately imposed on both commuters and residents of the city, towards taxes on buildings shifts the tax burden towards residents of San Francisco. Furthermore, it is unclear how this pricing scheme would work in the rental housing market. As long as tenants pay their own energy and water bills (and most do), they have the correct financial incentives to conserve. However, landlords do not have incentives to invest in building efficiency upgrades or ultra-efficient appliances because they do not recoup these investments in the monthly rental stream. One solution would be to impose increasingly ambitious energy efficiency upgrades at the point of sale. Because the residential UUT would increase over time, a greater percentage of tenants would receive the benefit of moving into more energy-efficient units.
Conclusion
Many other cities in California impose a residential UUT. While imposing such a tax has serious equity impacts as its burden falls heaviest on low-income households, this impact could be partially mitigated by the generally low energy bills and opportunities to pair this tax increase with other programs geared towards increasing the energy efficiency of our building stock. In addition, further analysis may need to be done on the behavior effects of such a tax in the rental market.
The Way It Is Now
As of spring 2007, San Francisco has used almost 77 percent of its solid waste disposal allowance according to its 1988 Waste Disposal agreement, which allowed for the City to transport solid waste for 65 years (or 15 million tons) to the Altamont landfill in Alameda County.6 In 2008, the SF Recycling and Disposal Company estimates approximately 600,000 total tons of solid waste will be disposed for the City. Total disposal tons are expected to decrease over the next few years to 540,000 tons in 2011.
In 2004, the San Francisco Department of the Environment commissioned a study to determine the composition of solid waste sent to landfill from San Francisco. Based on this composition, and using the EPA Waste Reduction Model, Snyder et al. (2007) conservatively estimate that San Francisco’s solid waste emitted 649,103 metric tons of carbon dioxide equivalent emissions in 2005 from recyclable or compostable materials alone. In other words, San Francisco could have avoided emitting nearly 650,000 tons of carbon dioxide emissions simply by recycling these materials.
Local Government Mechanisms for Solid Waste Reduction
A solid waste fee could be one way to encourage household solid waste reduction. We considered modeling a direct fee on a marginal unit of garbage produced by households and businesses. For administrative ease, the household fee could mirror the current residential rate structure, and could be scaled progressively to increase based on the quantity of garbage. While San Francisco’s current fee is based on container volume, the fee could be based on actual weight or volume to more accurately measure impact of waste disposal. While direct fees provide incentives for illegal dumping and littering, these impacts could be mitigated with fines.
What We Analyze
A solid waste fee of one cent per pound imposed on households and businesses in the city.
Environmental Benefits
The range of price sensitivity to increases in solid waste fees vary from a conclusion of no significant impact to a finding that a ten percent increase in unit pricing of garbage results in an approximately four percent decrease in the amount of garbage produced. The effect of increased unit pricing of solid waste on recycling activity also varies across studies. Only one study estimates the effect of an increased price of garbage collection on recycling, and finds that a ten percent increase in the price of garbage collection results in a one percent increase in recycling activity. Because demand for solid waste disposal services is not very sensitive to price, any fee placed on residents and businesses will produce minimal environmental benefits.87
Revenue Potential
A modest fee of one cent per pound, imposed directly on households and firms, could generate approximately $12 million in revenue in its initial year, or less than one percent of total payroll tax revenue. Because tons of disposable material is projected to decrease, without a fee, over the next decade, a solid waste fee would be a declining source of revenue.
Secondary Economic and Distribution Impacts
To be equitable, a solid waste fee would apply to both businesses and households. However, two-thirds of San Francisco’s residents are renters where the cost of garbage is typically paid by the landlord. This provides little incentive for reducing garbage use among tenants – even with a pass-through. As such, we would suggest that the solid waste fee not be imposed on households. This would also reduce the regressive impacts on low-income households.
Businesses currently produce about three-quarters of San Francisco’s solid waste and at far greater rates per person. In 2004, San Francisco residents produced approximately one pound per resident per day of solid waste, while businesses produced almost five pounds per employee per day, and about 4.3 pounds per $100 of taxable sales.8
Conclusion
While solid waste fees and taxes are more effectively implemented on a broader scale, possibly as a tax on raw resource use, the tax could yield revenues without significant economic impacts. Further, the tax could be imposed on businesses that would benefit from a decrease in the payroll tax. On the other hand, solid waste fees on residences would raise equity concerns. Also, solid waste generation is already predicted to decline (with no fee in place) and so it may only have minimal environmental impact.
The Way It Is Now
San Francisco currently taxes all off-street parking spaces throughout the city. Most off-street parking spaces are rented to a professional parking operator, who collects a fee from the parker along with the parking tax. The current tax rate is 25 percent of total parking charges.
Parking garage operators are often able to pass the price of the tax onto their patrons. However, this varies from garage to garage. City-owned garages make up 25 percent of all off-street parking spaces and do not impose the parking tax on patrons.9 They are also required to offer reduced rates to organized carpools, and therefore tend to have a higher concentration of non-resident drivers.
What Others Do
San Francisco’s parking tax is the highest in the Bay Area, and one of the highest in the nation. Berkeley and Oakland have the second-highest parking taxes in the Bay Area at ten percent. Of major cities in the U.S., Pittsburgh, PA has a parking tax rate of 40 percent, the highest in the nation.
What We Analyze
An increase in the parking tax from 25 percent to 27 percent, 30 percent and 35 percent.
Environmental Benefits
The environmental benefits from an increased parking tax depend on the behavioral shifts of both drivers and parking garage operators that could result in a decreased demand for parking and supply of parking. These environmental benefits include decreased congestion, a decrease in vehicle miles traveled and a mode-shift to public transit, both in the city and region.
Parkers can respond to the increased parking tax by changing modes, destinations and parking location, or by shortening parking duration and forgoing trips. Many studies predict that a ten percent increase in parking price reduces parking demand by one to six percent, with three percent being the most common reduction.10
Revenue Generation
Proposition A, passed in November, 2007, allocates 80 percent of parking tax revenues to the San Francisco Municipal Railway (Muni), San Francisco’s public transportation agency. The remaining 20 percent goes to the General Fund, and is traditionally then allocated to senior services. Because of the allocation to Muni, the parking tax has the ability to both encourage mode-shifting from driving to public transit, and provide funds to improve public transportation in the city.
An increase in the parking tax has the potential to raise between $5 and $28 million of additional dollars for San Francisco. The most recent estimates from the San Francisco Controller’s Office project that with no change to the tax rate, the parking tax will generate $65.73 million in fiscal year 2007-2008. Because the parking tax already exists in San Francisco, it is assumed that there would be very little additional administrative costs in collecting an increased tax.
Secondary Economic and Distribution Impacts
While it may be possible for garage operators to pass the cost of the parking tax onto the consumer, operator-borne costs of the tax increase may lead to an overall reduction in the parking supply. Furthermore, the indirect economic impacts from an increased parking tax include economic benefits that may stem from reduced congestion and improvements in public transportation systems with increased revenues.
Conclusion
An increased parking tax could provide both revenue generation and environmental benefits for the city. Parking tax revenues are already now mainly dedicated to senior services and Muni. Further revenues could be used to offset the payroll tax or to fund further improvements in public transit. Such improvements in the long run could generate both economic activity and additional environmental benefits for San Francisco.
The Way It Is Now
There are 320,000 on-street parking spaces throughout the city. San Francisco already has policies in place to increase the price of on-street parking. These options include increasing meter prices, and increasing and expanding the residential permit fee.
San Francisco operates approximately 24,000 meters throughout the city. The meter rates vary by neighborhood, from $3 per hour downtown, $2.50 in Fisherman’s Wharf and the downtown periphery, and $1.50 in other areas. Most meters operate from 7 a.m. or 9 a.m. to 6 p.m. Monday through Saturday. On Port property, meters run from
7 a.m. to 7 p.m. In Fisherman’s Wharf, meters are in effect everyday, including Sundays and holidays.
There are 27 residential parking permit areas in the city. Annual permits are $60. About one-third of the city’s curbside parking spaces are covered by residential parking permits.
What We Analyze
Several on-street parking pricing strategies, including parking demand management to increase occupancy, increasing residential permit prices by $10, expanding the residential permit program citywide, and expanding and increasing meter prices.
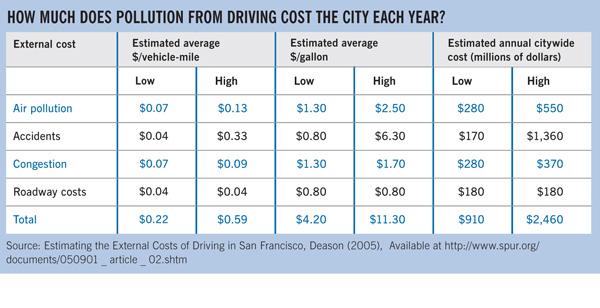
Transportation is the second main category of both greenhouse gas emissions and potential green taxes and fees. The negative environmental effects of driving are well documented. In 2005, SPUR estimated the external costs of driving in San Francisco. The results are summarized in this table.
Environmental Benefits
In a downtown where it takes an average of three minutes to find a parking space, and where parking turnover is ten cars per day, cruising around a block alone creates 60,000 vehicle miles traveled a year.11 For an average size car, that translates to roughly 66,000 pounds of carbon equivalent emissions.
Increasing the price of curbside parking will discourage congestion and vehicle trips. A recent study by the San Francisco County Transportation Authority of parking on Port property finds that demand for on-street parking is even less sensitive than standard studies of parking demand suggest. Specifically, the study finds that a 50 percent increase in metered parking pricing results in a five percent decrease in demand for parking. The level of increase depends on many local factors, including the popularity of a given neighborhood.
Revenue Potential
Our analysis shows that City could generate up to $50 million by changing the price of on-street parking. The two most promising changes are parking demand management (pricing parking to achieve an 85 percent occupancy rate for an estimated $6 to $30 million) and expanding residential parking permits citywide (for an estimated $10 million).
Secondary Economic Impacts and Distribution Impacts
Because off-street parking garages tend to cater more to commuters through long-term parking contracts, an increase in the price of on-street parking may affect tourists, visitors and shoppers more than commuters. Low-income individuals may also be more susceptible to increases in the prices of curbside parking. To mitigate these impacts, progressive pricing structures could be implemented, or low-income drivers could be exempt from certain taxes or fees.
The effect of increased parking pricing on businesses is ambiguous. On one hand, as with the parking tax, the increased cost of driving into urban shopping districts may encourage visitors to shop elsewhere in the Bay Area. However, the increased convenience and decrease in congestion from properly priced on-street parking will economically benefit businesses and consumers alike.
Conclusion
The City’s new pilot program, SF Park, should be analyzed before any additional increases in on-street parking prices are proposed. Such revenues could be used to fund transit or to fund public services in neighborhoods that experience increased meter pricing. While this latter option will not reduce the payroll tax burden, taxes that reduce congestion and make parking more convenient have the potential to increase economic activity by making San Francisco a more accessible and convenient place to work, live and visit.
The Way It Is Now
Congestion pricing or road pricing is the practice of charging drivers fees to use certain roads during certain hours, in order to encourage mode-shifting to public transit and bicycling and to decrease traffic congestion. According to the San Francisco County Transportation Authority (SFCTA), the Bay Area is the second most congested metropolitan area in the nation. Only 28 percent of the one million daily trips to the downtown, SoMA and Civic Center neighborhoods are made via public transit. In response to these statistics, the SFCTA has begun to study the possibility of a congestion pricing scheme for San Francisco. While specific results and recommendations are not yet available, our analysis roughly describes the effect of a congestion pricing scheme in the city.
What Others Do: London Congestion Pricing
Congestion pricing has been implemented internationally in many cities, most famously in London, but also in Stockholm, Singapore, Milan and others. The London scheme charges motorists driving in central London eight pounds on weekdays between 7 a.m. and 6:30 p.m. Exemptions from the charge include motorcycles, taxis, some alternative fuel vehicles, buses, emergency vehicles and vehicles used by those with disabilities. Area residents receive a 90 percent discount for their vehicles. Drivers can make payments through retail outlets, payment machines, the Internet, and by text messaging. The scheme is enforced with a network of video cameras that record the license plate numbers and match these numbers to the list of payments. A fine is charged for users who do not pay.12
The London system is considered less than optional because it deviates in a number of ways from an economically efficient system. First, the fee is not based on vehicle miles traveled. Second, the fee is not time-variable, nor does it vary by location. Third, the system has high overhead costs.
Despite these challenges, the London system is considered to have an overall positive impact. In the first year of the scheme, the total number of vehicles in the charging area decreased by 18 percent, and the average speed in the zone increased from 14 km per hour to about 17 km per hour. Bus ridership increased by 14 percent and due to more efficient travel, taxi costs declined by about 20-40 percent. Yearly carbon dioxide emissions were estimated to decrease by 18 percent and despite large overhead and maintenance costs, net revenues amounted to approximately $200 million.13
What We Analyze
While specific results and recommendations of the SFCTA’s study are not yet available, the following general analysis estimates the effects of a congestion pricing scheme for San Francisco.
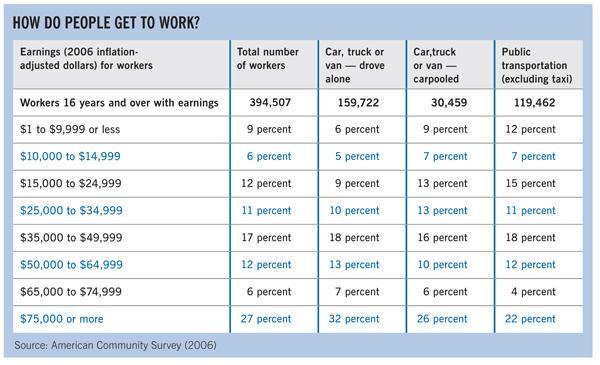
This table reports commuting modes for San Francisco in 2006. Only 3.1 percent of those who drive alone fall below the poverty line. This suggests that the burden of transportation and fuel taxes may fall more heavily on wealthier individuals.
Environmental Benefits
The environmental benefits of a congestion pricing scheme include reduced congestion, vehicle miles traveled and air pollution. The exact benefits will depend on which areas of San Francisco are covered, the amount charged per vehicle, the fee structure and the elasticities of demand for driving in the covered area.
London and Stockholm experienced a 15-30 percent decrease in congestion, a 20-30 percent reduction in vehicles in the congestion zones and an increase of 30-50 percent in reliability of trips for both automobiles and transit. Studies of these congestion pricing schemes also estimate a 10-18 percent reduction in greenhouse gas emissions. Because San Francisco is a smaller city, its environmental benefits will most likely fall on the lower end of these estimates.
Revenue Potential
San Francisco’s scheme can again be compared to Stockholm’s and London’s scheme, which raised $50 million and over $200 million in net revenues, respectively. Again, San Francisco’s scheme will probably produce revenue on the lower end of this scale, considering that only peak times will be charged and that San Francisco has a smaller population.
Secondary Economic and Distribution Impacts
Depending on their design, congestion pricing schemes can have a number of secondary economic impacts, including decreased business for retailers that depend on car transportation and/or decreased parking receipts and revenues. On the other hand, if successful, a congestion pricing scheme in San Francisco could have the ability to improve the conditions and reliability of both vehicle transportation and transit.
Conclusion
A congestion pricing scheme for San Francisco could raise a lot of revenue. While a portion of the potential revenue from congestion pricing would certainly flow to Muni, it is unlikely if much of it could be used to directly offset the payroll tax, particularly if San Francisco is not the entity collecting the tax. Still, if properly designed, a congestion fee could most closely mirror the mix of residents and commuters affected by the payroll tax.
The Way It Is Now
About 135,000 off-street parking spaces in the city are free to users, and as a result, the costs of these parking spaces, reflected in vehicle trips and air pollution, are not captured by the parking tax. Many of these parking spaces are in front of grocery stores, malls or big-box stores. Assessing a parking space impact fee on these spaces would help to internalize the environmental costs of free off-street parking in the city.
What We Analyze
A $104 impact fee annually on each free off-street parking space in the city.
Environmental Benefits and Revenue Generation
Because a fee on free off-street parking cannot be passed onto users, the fee may instead decrease the supply of free parking available in the city, and therefore indirectly encourage mode-shifting and decreased vehicle trips. As a result, the fee by itself will produce a stable revenue source, but minimal direct environmental benefits. In a 2006 SPUR report, “Muni’s Billion Dollar Problem,” we estimated that a fee of $104 per parking space annually could generate $14 million annually in revenue.
Secondary Economic and Distribution Impacts
The burden of an off-street parking space impact fee will fall on large retail stores with parking lots. This will increase the cost of doing business in the city for these retailers. Such a fee may also decrease the supply of free off-street parking in San Francisco. However, it would make parking pricing in San Francisco more equitable by ensuring that the pricing scheme affects all spaces.
Conclusion
SPUR has already called for an off-street parking space impact fee. As with our on-street parking analysis, any tax or fee that makes San Francisco more easily accessible will increase long-term economic activity.
The Way It Is Now
The vehicle license fee (VLF) is an annual fee on the ownership of a registered vehicle in California. The level of the fee is controlled by the state government. After they are collected by the state, VLF revenues are distributed to cities and counties. Since 1998, the California Legislature has reduced the VLF from a level of two percent of a vehicle’s current estimated value down to an effective rate of 0.65 percent. Increasing the VLF requires state enabling legislation.
Two pieces of legislation have attempted to increase the VLF for San Francisco to a historic two percent, and to apply a vehicle impact mitigation fee to vehicles registered in San Francisco. AB1590, which would enable the City to raise the VLF, is currently in the Senate Revenue and Taxation Committee. AB1208, which would assess a flat $5 vehicle impact mitigation fee upon registration, was vetoed by the governor.
What Others Do
Many similar fees exist at the regional and local level in the Bay Area. The Bay Area Air Quality Management District assesses a flat $4 vehicle registration fee to fund traffic mitigation, and San Mateo County imposes a $4 fee to fund traffic mitigation and water quality programs. A new fee structure based on a vehicle’s emissions levels, or a fee that increases with each additional car a household registers would be a more economically efficient tax than a flat fee.
Environmental Benefits and Revenue Generation
Currently, around 450,000 vehicles are registered in San Francisco.14 The proposed fees themselves are small, and are unlikely to decrease vehicle ownership in San Francisco. However, revenues from the fees can be used to fund environmentally beneficial programs, such as public transportation improvements and congestion mitigation projects. Increasing the VLF to two percent could raise $60 million dollars annually for the city, while applying an impact mitigation fee of approximately $100 could generate a net potential revenue of approximately $36 million.
Secondary Economic and Distribution Impacts
While car ownership among low-income individuals is low, the VLF and a flat fee on vehicle ownership can disproportionately affect low-income individuals. A study of the incidence of the VLF finds that some of California’s poorest households pay up to one percent of their annual income in vehicle license fees. In this sense, the VLF is regressive. Many low-income households, however, do not own a car. Of the 5.7 percent of California households that do not own a vehicle, 84 percent have incomes of less than $20,000.15
Conclusion
In the past, SPUR has suggested the increase in a VLF to two percent as well as a vehicle impact fee for San Francisco. While such a fee will have small environmental impacts, the possible revenue generation and subsequent potential improvements to transit may provide long-term economic and environmental benefits.
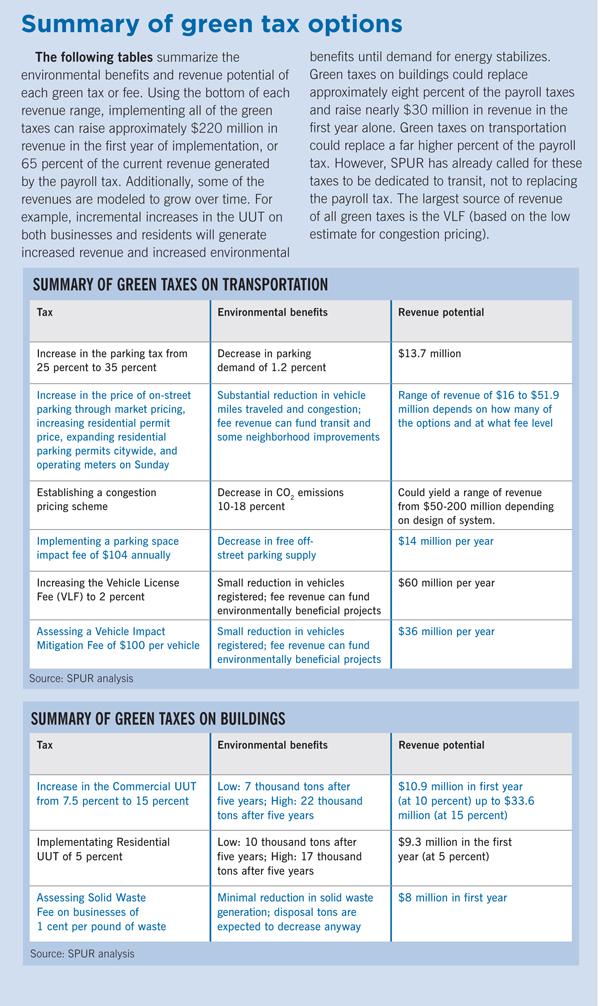
Overall conclusions
An inherent tension exists between environmental benefits and revenue generation. If the fundamental goal of a green tax is its benefit to the environment, then setting a high green tax or fee would be crucial to meeting environmental goals. However, setting a high tax or fee also discourages the environmentally detrimental behavior that is being taxed, and as a result, this behavior is a declining source of revenue until demand for this behavior adjusts to the new price level.
Alternatively, if revenue generation is the main goal of a green tax or fee, then the level of the tax or fee should be set in order to stabilize the tax or fee as a revenue source. Taxes on certain activities could produce a stable revenue source if set at a moderate level, since these taxes motivate minimal behavioral change. Any environmental tax reform policy will face trade-offs between environmental benefits and revenue generation.
However, our analysis draws important conclusions about the potential of environmental tax reform for San Francisco. Overall, by shifting taxes away from businesses, San Francisco could encourage job growth and economic activity in the city. More concentrated job growth in San Francisco also could have secondary environmental benefits — such growth would reduce job sprawl and the negative environmental impacts that accompany sprawl, like increased driving and air pollution. In parallel, by implementing green taxes, San Francisco could encourage environmental benefits, increase quality of life in the city, and remain a leader in and an example of innovative environmental policy. The benefits from green transportation taxes, including reduced congestion and better transit, could also, in the long run, encourage economic growth in the city.
.
San Francisco businesses pay, by far, the highest business taxes in the Bay Area. An average general office firm in San Francisco pays approximately $60,500 in payroll taxes, while an average general office firm in Oakland pays $4,800, and in San Jose pays $1,806. This disparity in business taxes may decrease San Francisco’s competitiveness in the region.
While the results are supportive of an ETR scheme, it should be noted that these studies are conducted at the national level, and in some circumstances, the double dividend of ETR is not always guaranteed.
However, SPUR has already suggested that most of these revenues should be dedicated to an expansion of our public transit system. This means that the new transportation taxes and fees cannot be part of a tax shift away from local business taxes. This further confirms that environmental tax reform in San Francisco cannot replace the payroll tax revenues with new green taxes and fees as the best source of revenue should go to transit.
A common concern with environmental taxes is that they tend to be regressive — they disproportionately fall on low-income individuals and households. This is especially true of green taxes on residential energy use and solid waste. However, the structure of the environmental tax can mitigate regressivity by exempting low-income households from paying the tax up to a certain threshold level, or scaling the tax by consumption level to make it more progressive. This approach is already common on water and energy bills.
Over the past five decades, population growth and job growth have been slow in San Francisco relative to the region. From 1969-2005, San Francisco’s rate of job growth has been surpassed by all of its surrounding counties.
This graph compares the average level of payroll taxes versus an average of all other taxes across all types of firms in various Bay Area cities. Many cities do not impose any tax on employees or payroll and instead rely on a simple business registration fee.
Transportation is the second main category of both greenhouse gas emissions and potential green taxes and fees. The negative environmental effects of driving are well documented. In 2005, SPUR estimated the external costs of driving in San Francisco. The results are summarized in this table.
This table reports commuting modes for San Francisco in 2006. Only 3.1 percent of those who drive alone fall below the poverty line. This suggests that the burden of transportation and fuel taxes may fall more heavily on wealthier individuals.
ENDNOTES
1 Bureau of Economic Analysis. 2008. Regional Economic Accounts, http://www.bea.gov/regional/index.htm.
2 ICF International et al. 2007. Sustaining Our Prosperity: The San Francisco Economic Strategy, http://www.sfeconomicstrategy.org/site/economic_index.asp.
3 City and County of San Francisco, Office of the Controller. 2005. The Payroll Tax, http://www.sfgov.org/controller.
4 Bartik, Timothy. 1992. “The Effect of Local and State Taxes on Economic Development: A Review of Recent Research.” Economic Development Quarterly. 6:102. and Phillips, Joseph and Ernest Goss. 1995. “The Effect of State and Local Taxes on Economic Development: A Meta-Analysis.” Southern Economic Journal. 62:2.
5 Lipow, Gar. 2007. “Price Elasticity of Energy Demand: A Bibliography,” http://www.carbontax.org/issues/energy-demand-how-sensitive-to-price.
6 Snyder, Pamela et al. 2007. “The Business Case for a San Francisco Waste Offset Fee,” San Francisco Department of the Environment, http://www.sfenvironment.org/downloads/library/nagementreportdecember2007.pdf.
7 Kinnaman, Thomans and Don Fullerton (2000). “The Economics of Solid Waste Management”. NBER Working Paper 7326.
8 The California Integrated Waste Management Board. County Waste Profiles, http://www.ciwmb.ca.gov/Profiles/County/default.asp.
9 City and County of San Francisco, Office of the Controller. 2005. The Parking Tax, http://www.sfgov.org/controller.
10 TCRP. 2005. “Parking Prices and Fees: Traveler Response to Transportation System Changes,” Transit Cooperative Research Program Report 95.
11 Shoup, Donald. 2003. “The ideal source of local public revenue”. Regional Science and Urban Economics. 34: 753-784.
12 Litman, Todd. 2004. “London Congestion Pricing”. Victoria Transport Policy Institute, http://www.vtpi.org.
13 U.S. Department of Transportation. 2006. “London Congestion Pricing”. Benefits Database, http://www.itsbenefits.its.dot.gov/its/benecost.nsf/0/7D906228368AEE2585257315005B7D26.
14 Metropolitan Transportation Commission Data, http://www.mtc.ca.gov/maps_and_data/datamart/stats/regveh.htm.
15 Dill, Jennifer, Todd Goldman, and Martin Wachs. 1999. “The Incidence of California’ Vehicle License Fee,” prepared for the California Policy Research Center.