With details of continued lifeline loans from the state still unclear, transit agencies may face imminent budget cuts sooner than expected, putting the future of public transit in the Bay Area in danger. BART, Muni, Caltrain, and AC Transit, which together account for more than 80% of all transit ridership in the region, face combined deficits of more than $800 million annually.
Senate Bill (SB) 63, introduced by senators Scott Wiener and Jesse Arreguin, seeks to address this challenge by authorizing a 2026 ballot measure to fund transit in San Francisco, Alameda, Contra Costa, San Mateo, and Santa Clara counties. The proposed measure would raise sales tax by half a cent in all of the counties (and by one cent in San Francisco) and would generate more than a billion dollars annually. These funds would be used to shore up transit operator deficits, invest in improved services, and support regional transit integration programs, though this revenue would take effect in 2027, not soon enough to address the immediate crisis.
While SB 63 has advanced through the legislature thanks to the collective efforts of its authors, policymakers, public agencies, and transit advocates like SPUR, the process of reaching regional consensus on how to support transit has been challenging. In particular, the question of just how “regional” the transit system is — and, consequently, which jurisdictions and residents should reasonably fund specific operators or elements of the transit system — dominates many discussions related to SB 63.
So is Bay Area transit more of a regional asset, a local asset, or both? SPUR used Replica, a data platform and a travel modeling software program, to understand the “regionality” of Bay Area transit and how it compares with the regionality of other travel modes. To inform our research, we looked at data including where people began and ended their trips, as well as mode of travel (car, transit, biking, walking, etc.) and official daily ridership data from Muni and BART. We sought to answer two questions: First, how regional are transit trips in the Bay Area? Second, what are the implications of potential transit cuts?
For the purposes of this analysis, we have focused on the five counties participating in SB 63: Alameda, Contra Costa, San Francisco, San Mateo, and Santa Clara.
How Regional Are Transit Trips?
Replica’s data show that, on a typical weekday in fall 2024, some 5.52 million people traveled within the five-county subregion of the Bay Area, making a cumulative 23.8 million one-way trips. SPUR broke the data down by purpose — including going home, to school, and to work — and by travel mode — including by private car, public transit, walking, and cycling. Of these trips, a total of 16.4% involved travel between counties.
While transit trips represent a small portion of the total trips made on a typical weekday, SPUR’s analysis shows that they play an outsized role in regional connectivity. Specifically, Replica’s data indicate that, within the five-county subregion, transit trips are 70% more likely to be regional than car trips. Expressed another way, 27.1% of transit trips are inter-county while just 16.1% of trips made by drivers and auto passengers go between counties. A comparative breakdown of trips within and between the five counties illustrates the relatively higher “regionality” of transit trips and underscores the importance of transit particularly within San Francisco.
Trips Within and Between the Five Counties
SPUR research shows that transit trips are 70% more likely to be regional — from one county to another — than car trips, making a truly regional transit system critical for transit users.
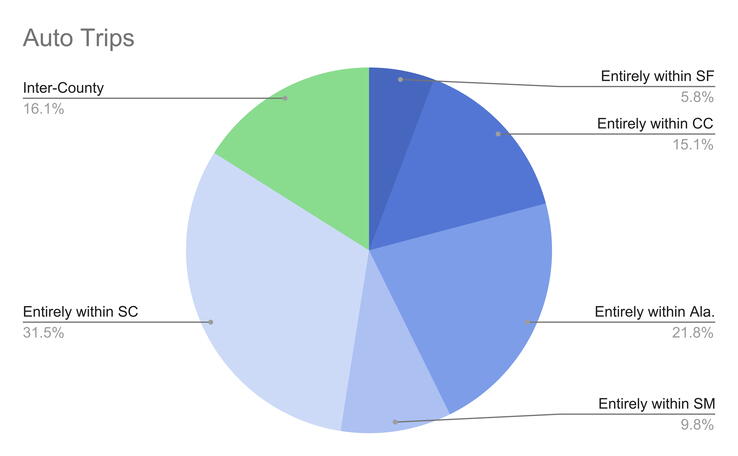
Source: SPUR’s analysis of Replica’s data.
Further analysis of Replica’s data reveals that the top three purposes for inter-county transit travel are going to work, followed by going home and going shopping. The top three purposes for car travel and transit travel within a county are going home, followed by going to work and going shopping. In other words, regional transit disproportionately helps people get to work.
Relative Distribution of Trips in the Five-County Area by Trip Purpose
On a typical fall 2024 weekday, 23.8 million one-way trips are made in Alameda, Contra Costa, San Francisco, San Mateo, and Santa Clara counties, seen here broken down by trip purpose.
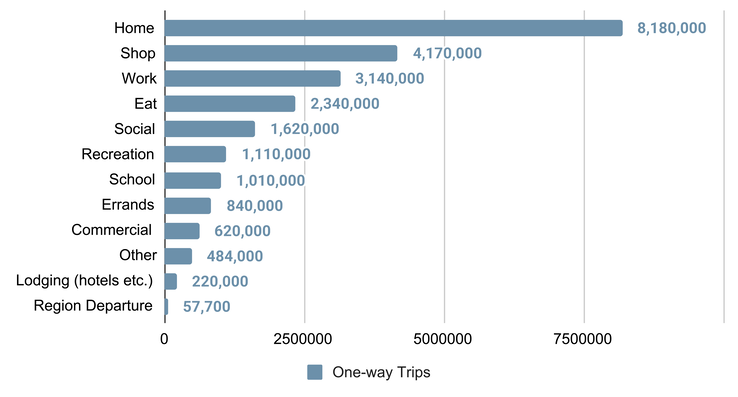
Source: SPUR’s analysis of Replica’s data.
Crucially, these commutes and other transit trips often involve multiple agencies. The Metropolitan Transportation Commission’s 2021 Bay Area Fare Coordination and Integration Study found that some 14% of daily transit riders using the Clipper payment system access more than one operator for a single trip; BART and Muni trips are particularly likely to be combined with a trip via another operator. Therefore, failure of one operator would cause a serious loss of ridership for other operators. If even one agency lacks adequate funding, first- and last-mile connections would significantly lengthen, as would travel times, and buses and trains would become more crowded, making transit a less viable option for commuters.
What Are the Implications of Potential Transit Cuts?
SPUR’s research shows that transit plays an outsized role in regional connectivity, and looming service cuts would have similarly outsized regional impacts.
Commuter Impacts
While the worst effects of transit service cuts would obviously be felt by transit riders, all commuters would experience the negative repercussions of transit service reductions. Replica’s data show that 30% of transit riders don’t have access to a vehicle. Infrequent transit service will mean these riders would experience longer travel and wait times, while the remaining 70% might choose to drive given poor transit service levels.
Auto congestion — especially on freeways — is highly sensitive to small changes in vehicle volume. Just 3% to 5% fewer vehicles can cut traffic delays by up to 70%. Similarly, should even a small percentage of transit riders begin to drive, the increase in travel times and congestion for all drivers would be dramatic. In a world without BART, the number of vehicles on the Bay Bridge would increase by 73% (5,400 vehicles), adding 10 hours of traffic delay every week for the average commuter from East Bay cities like Fremont and Walnut Creek.
Weekly Hours Lost to Congestion for Drivers, With and Without BART
The loss of BART would trigger a 73% increase in vehicles on the Bay Bridge, subjecting the average commuter from East Bay cities like Fremont and Walnut Creek 10 additional hours of traffic every week.
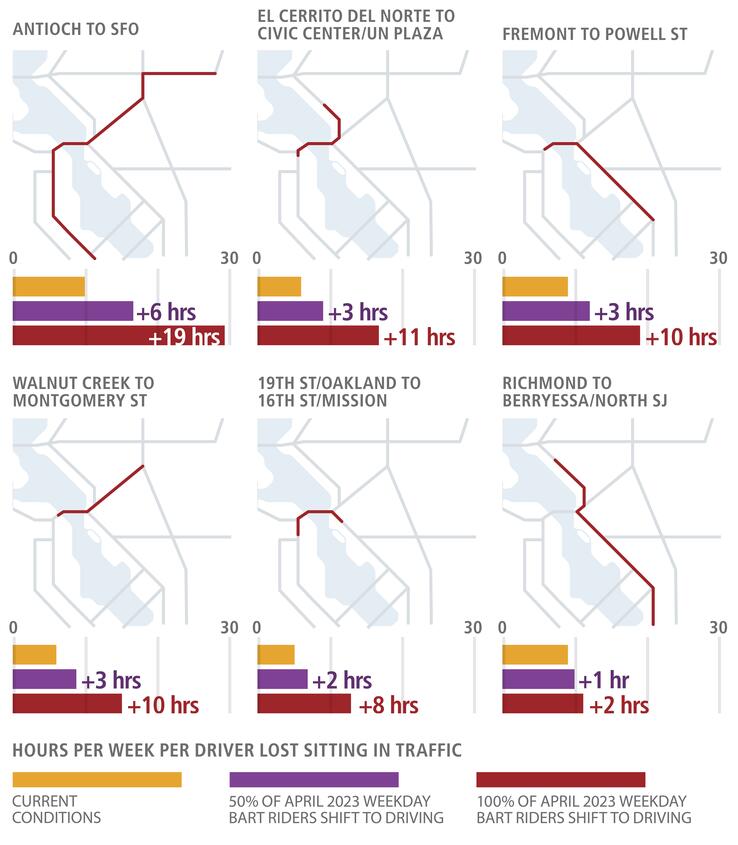
Source: BART's Role in the Region.
The Bay Area glimpsed this future when a computer error led to a full BART system outage last Friday. At 7 a.m., crossing the Bay Bridge alone was estimated to take 40 minute s. Similarly, this past May’s system outage saw an additional 1,800 cars crossing the Bay Bridge from 6 a.m. to 9 a.m.; the San Mateo-Hayward and Dumbarton bridges also saw greatly increased traffic. Without adequate BART service, and without Muni, AC Transit, Caltrain, and SamTrans to pick up the slack, the Bay Area could begin to see crushing traffic at all times on its bridges and roadways.
San Francisco rush-hour traffic is now the second-worst in the country, behind only New York City. Additional congestion will prevent employees from accessing their jobs and prevent goods from reaching their destinations, decimating the economic health of the Bay Area. In 2014, traffic cost the Bay Area $3.1 billion. That amount could be much higher if transit is not funded.
Economic Impacts
Beyond congestion, reliable and extensive public transit is essential for returns to in-person work across the region, particularly returns to downtown San Francisco. As the city rebounds from the pandemic and continues to fill office vacancies, commuters need a reliable means of getting to the workplace. In 2019, downtown San Francisco saw 470,000 daily commuters from out of town, a number that the city could approach again.
Climate Impacts
Transit plays a critical role in lowering greenhouse gas emissions; longer, regional trips on transit are especially impactful. Private vehicles currently account for 27% of the state’s total emissions. Without transit, this share would substantially increase. A region without BART alone would see an estimated daily increase of 780,000 to 1.56 million vehicle miles traveled, or 35,000 to 70,000 more gallons of gasoline burned. As a state that pledged to achieve net-zero emissions by 2045, California must remain committed to transit across the Bay Area, where 30% of the state’s transit riders reside.
Equity Impacts
By connecting job centers to more affordable housing areas, transit helps equalize Bay Area residents’ access to economic opportunities. A regional transit collapse would disproportionately hurt lower-income residents, who have already been hit hard by the region’s pandemic-related transportation inequities. According to a Metropolitan Transportation Commission survey, transit riders are four times more likely to live in poverty as the average Bay Area resident, are more likely to be Black or Latino, and are more likely to live with a disability. Another major blow to transit access could further decrease socioeconomic and racial equity in the region.
SB 63 to the Rescue?
Transit in the five Bay Area counties covered by SB 63 plays a vital role in minimizing commuter delays (both on transit and roads/bridges), facilitating the return to in-person work, continuing the region’s economic recovery, lowering greenhouse gas emissions, and equalizing access to economic opportunities. Because transit trips are far more likely than driving trips to cross county lines, the fight for transit funding must be regionally integrated. Moreover, every Bay Area transit agency must be adequately funded to ensure seamless transit service. Only through the passage of SB 63 in this legislative cycle, along with the passage of its November 2026 ballot measure, will the Bay Area avert the transit fiscal crisis and avoid detrimental effects on traffic, the regional economy, and California’s environmental and equity goals.