In a post–COVID hybrid work environment, cities with more economically diverse downtowns have fared better than those that are primarily dominated by tech office jobs. San Francisco is the second-most homogenous downtown in the United States, with more than 74% of its land area devoted to office uses. By comparison, those uses occupy only 49% of downtown Manhattan. Because of the diversity of businesses and land uses, including housing, entertainment, and academic institutions in Manhattan’s high-density downtown areas, foot traffic is significantly higher there than in San Francisco, even though return-to-office rates are below 50% in both cities.
What does this comparison mean for downtown San Francisco’s recovery? Introducing housing, adding more culture and entertainment uses, and attracting institutional uses like universities and hospitals will make the city more resilient in the long term and drive new investment downtown at a crucial moment. One key way to diversify downtown San Francisco is to repurpose its functionally obsolete class B and C office buildings while preserving its role as the region’s densest employment center.
Doing so will ensure that commercial office tenants continue to be an important driver of the city and region’s economy and also will support small businesses, nightlife, and the arts by attracting people, especially in the evenings and weekends. In addition, the new uses will generate more municipal tax revenues than largely empty office buildings, allowing the city to continue providing essential services to residents, workers, and visitors.
What has happened to San Francisco’s office market?
San Francisco’s commercial office market went from the strongest in the country before the COVID-19 pandemic to the weakest, having the highest office vacancy rate in the nation.
Increase in Office Vacancy Since the Fourth Quarter of 2019, San Francisco Compared with Other Major U.S. Cities
Among the 14 largest U.S. office markets, San Francisco has gone from the strongest to the weakest. Click image to enlarge.
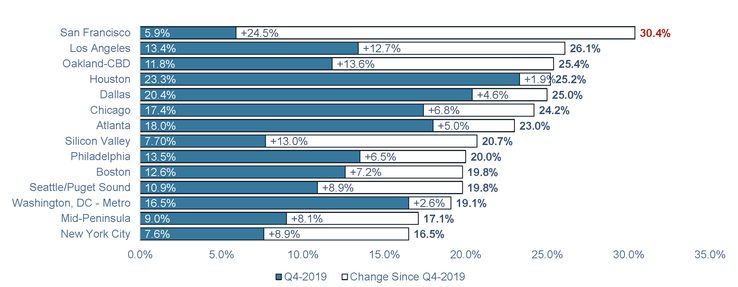
As of the third quarter of 2023, San Francisco’s office vacancy rate was 28.3%, its highest ever. At the peak of the Great Recession, in 2008, the city’s office vacancy rate was 17.7%. Right now, more than 30 million square feet (of a total inventory of 86 million square feet) are available to rent in San Francisco, representing an availability rate of 35%. As of September 2023, class B and C spaces have an availability rate of 37% (9 million of 25 million square feet).
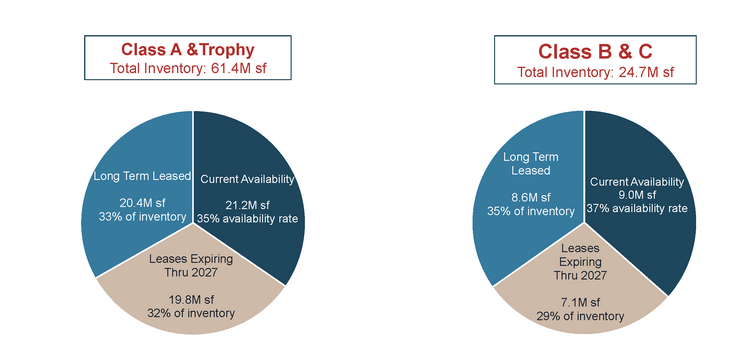
Availability by Building Class
More than 30 million square feet of office space is now available to rent. The availability rate is higher for Class B and Class C buildings, which have more than 9 million square feet of space available.
| Office Building Class | Total Inventory | Total Available Space | Availability rate |
| Class A | 61,398,769 | 21,228,151 | 35% |
| Class B | 22,707,688 | 8,264,622 | 36% |
| Class C | 2,049,289 | 784,477 | 38% |
| Total | 86,155,746 | 30,277,250 | 35% |
Source: JLL, 2023
How is class B and C space faring?
In San Francisco, the amount of office space that was leased on average (average annual absorption) during the period from 2000 to 2019 was 500,000 square feet. From 2011 to 2019, the office market was robust, and the average annual absorption was 1.5 million square feet. However, the demand for class B and C space over that period was weak. From 2000 to 2019, the average annual absorption for class B and C office space was negative (-60,000 square feet per year), meaning that more space was vacated than leased. If we exclude the dot-com bust of 2000 to 2002, the average absorption of class B and C space from 2003 to 2019 was 180,000 square feet. Even in the peak office market period of 2011 to 2019, when the overall market averaged nearly 1.5 million square feet per year, class B and C absorption was negative in some periods. As new Class A office buildings were completed, tenants migrated from outdated class B and C spaces into these nicer spaces.
This pattern has persisted through the post-pandemic period. Across the country, there has been a flight to quality, with the strongest tenant demand in premium buildings that have better amenities, such as high ceilings, views, wellness characteristics, access to outdoor space, and the most modern technology and mechanical systems. Best-in-class “trophy” office buildings have massively outperformed class B and C commodity office stock in San Francisco. The top 20 buildings have an availability rate of 19% compared with 35% for other buildings. The flight to quality trend is almost certain to persist as employers seek high-quality space to attract and retain employees and encourage them to spend time in the office.
Net effective rents are down between 20% (Class A buildings) and 40% (class B and C buildings). The combination of significantly higher vacancies, lower effective rents, and higher interest rates have resulted in buildings selling for about 20% to 33% of their pre-pandemic value.
Real estate company Cushman and Wakefield estimate that as much as 25% of all U.S. office space will be obsolete by 2030. In San Francisco, about 14 million square feet of class B and C space can be considered obsolete. This space is defined as class B and C buildings built before 1990 that had not been renovated in at least 30 years.
What will happen to office space over the next three to four years?
Many tenants have expiring leases over the next two to four years, and approximately 19.8 million additional square feet of Class A space (32% of the inventory) and another 7.1 million square feet of class B and C space (29% of inventory) will become available. While much of the Class A space will likely be taken up by new tenants, based on historical patterns, only half of the Class B and Class C space is likely to be re-tenanted.
Class A and Class B and C Space, Current Availability, Plus Expiring Leases as a Percent of Total Inventory
As leases expire, an additional 27 million square feet of space will become available by 2027. Click image to enlarge.
We prepared two scenarios to project future demand for office space. In a slightly more optimistic scenario, about 75% of Class B and C space with expiring leases is filled with new tenants, and the amount of available space peaks at 11 million square feet by the end of 2027. In the other, worse case, scenario, approximately half of the Class B and C space with expiring leases is re-tenanted, and the amount of available space reaches 13 million square feet by the end of 2027.
How long will it take for the office market to rebound?
Looking at historic absorption patterns, we can project how long it could take for the San Francisco office market to return to a healthy vacancy rate.
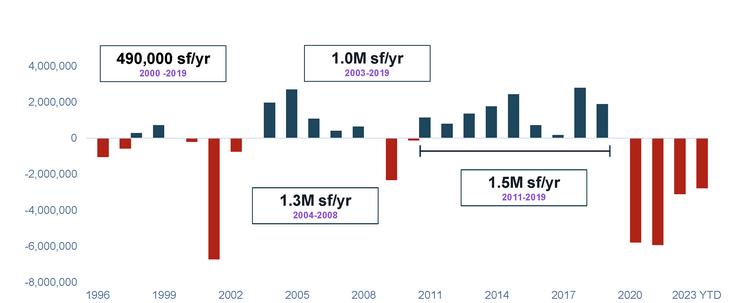
Historic Office Market Absorption
San Francisco’s office absorption rate fluctuates with the times. It was 1.5 million square feet per year during the boom of 2011 to 2019, but over the longer period of 2000 to 2019, which includes periods of both strong job growth and recessions, the office absorption was close to 500,000 square feet per year. Click image to enlarge.
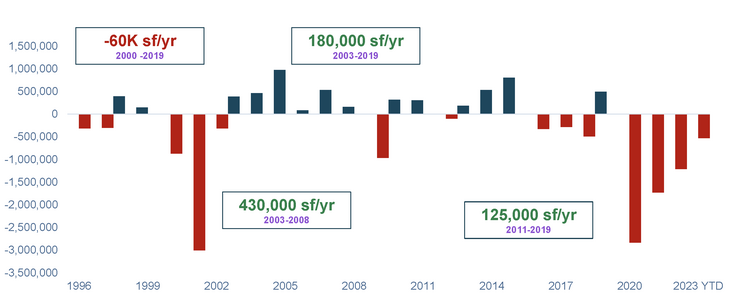
Historic Class B and Class C Absorption
Average Class B and Class C absorption has been negative from 2000 to 2019. If we exclude the dot-com bust of 2000 to 2002, the average absorption was 180,000 square feet. Click image to enlarge.
Based on today’s availability, the number of leases expiring over the next four years, and historic average annual absorption levels, SPUR estimates that it would take more than 40 years for the Class B and Class C office market to return to a healthy, more historically typical office vacancy level of 12%.
How can conversions help accelerate office recovery?
Removing obsolete space from the market will accelerate San Francisco’s office market recovery. When office vacancy is healthy, the rental rates begin to stabilize and grow, creating the market conditions necessary to spur development of the next generation of modern, trophy office buildings. San Francisco has more than 10 million square feet of entitled, approved office space that could be built when the market recovers. If the city were to implement policies to incentivize the conversion of five million square feet of class B and C space, it would shrink the timeframe for the class B and C office market to return to a healthy vacancy rate by approximately 20 years.
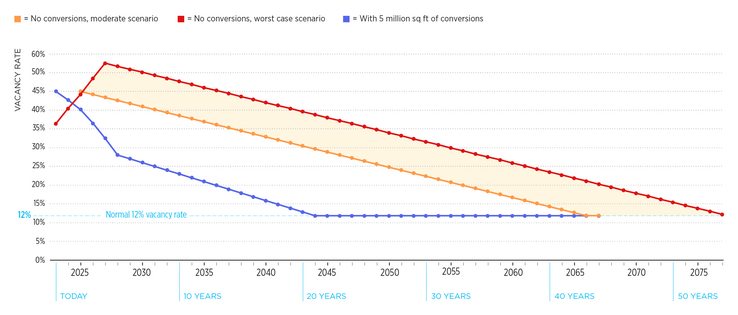
Projections of Time Frame for Class B and C Office Market to Return to Healthy Vacancy Levels, With and Without Incentives
Assuming average absorption levels (200,000 square feet annually), it could take 43 to 54 years to absorb enough vacant class B and C space to get back to a historically typical 12% vacancy rate. The class B and C office market would return to a healthy vacancy level 20 years faster with incentives to convert 5 million square feet. Click image to enlarge.
How can public investment encourage conversions to deliver economic and fiscal benefits to the city?
SPUR’s From Workspace to Homebase report demonstrated that conversions of functionally obsolete class B and C buildings in downtown San Francisco could be financially feasible through a combination of incentives, including reductions in property taxes. In the mid-1990s, when Lower Manhattan office spaces were struggling to attract tenants, New York incentivized office-to-residential conversions with a property tax abatement program for 15 years, resulting in the development of almost 13,000 housing units and increasing economic and social activity in the area. Implementing a similar program in San Francisco raises concerns about the fiscal losses for the city’s budget during the incentive period. To examine this issue further, SPUR worked with economic and financial consulting firm Economic & Planning Systems to analyze the long-term fiscal benefits of conversions.
Our analysis assumes a 20-year incentive period for as much as 5 million square feet of office space. During this period, the city would forego property tax revenues on the incremental value of the converted buildings. The analysis shows that although the fiscal impact would be negative during the 20-year rebate period, the converted residential buildings would resume generating significant property tax values for the city.
Property Tax Implications of Conversion Incentives vs. No Incentives
If incentivized, conversion of vacant office buildings to housing could generate significant local property tax revenues over the long term. Click image to enlarge.

Moreover, converting obsolete spaces into housing would generate more economic activity, create construction jobs, and support small businesses.
The Takeaway
The San Francisco office market is likely to take multiple decades to return to a healthy level of occupancy. Furthermore, in a post-COVID environment in which tenants demand newer, high-quality office space, class B and C spaces are less competitive for attracting businesses and would take even longer to be leased. The mounting vacancies and attendant consequences for San Francisco’s municipal budget threaten to further degrade quality of life not only downtown, but also in the city’s neighborhoods. The social and economic health of downtown San Francisco will rely on strategies to creatively repurpose a significant portion of obsolete office buildings to diversify land uses and activate downtown streets. Policies that incentivize conversions have been successful in many other North American cities, and San Francisco can learn from their example.
*About the Authors
Sujata Srivastava is SPUR’s housing and planning policy director.
Jack Sylvan is principal of Sylvan Development Group and a SPUR board member.
Thanks to Chris Pham and Alexander Quinn of JLL and Ben Sigman of Economic and Planning Systems for providing data for this article.