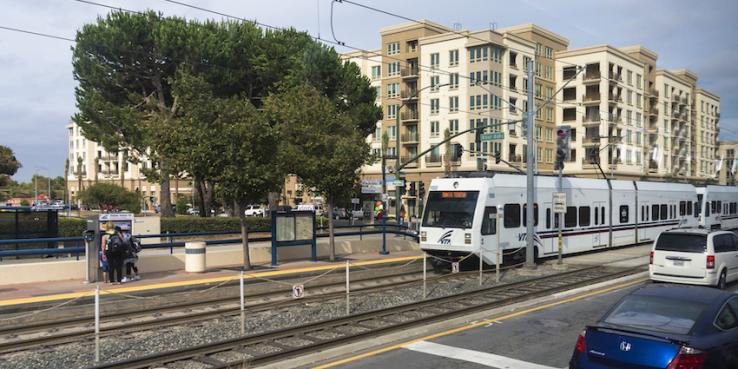
Planning for the transit service we want involves many choices and tradeoffs, with far-reaching implications for our quality of life. Being clear about what we are choosing between helps us make better decisions. The new Transit Choices Report from the Santa Clara Valley Transportation Authority (VTA) clearly lays out the next big transit choices for the South Bay.
This independent evaluation of Santa Clara County’s bus and light rail network is part of a two-year effort to create VTA’s “Next Network,” a redesign that aims to provide better connections to future BART stations, improve overall ridership and improve farebox recovery (the percentage of operating costs covered by passenger fares). To develop this project, VTA hired Jarrett Walker + Associates. Walker is known for his ability to articulate transit choices to decision-makers. (His easily-digested book Human Transit is a must-read if you care about transit.)
The 2018 opening of the BART extension to Berryessa in San Jose — and a desire to address stagnating ridership and declining farebox recovery rate — inspired VTA to take an honest look at where the system is performing well, where it’s not and how it should change. As SPUR described in the 2014 report Freedom to Move, transit in Santa Clara County has not enjoyed consistent success. The county’s modern transit system of buses and light rail was overlaid on top of a car-oriented landscape where transit stops are hard to get to, long distances separate homes and jobs, driving is typically fast and parking is free. Outside of the old streetcar downtowns (like San Jose, Campbell and Mountain View), most places are not transit-friendly.
But opportunities for transit to turn a corner are emerging: By 2040, the county will absorb an estimated 644,000 new people and more than 300,000 jobs within its existing urban growth boundary. This will lead to denser neighborhoods, which means the market for transit will grow naturally, without the need for major infrastructure projects. We all need transit to succeed if the county wants to grow without gridlock.
Findings We Can't Ignore
The Transit Choices Report begins with an honest accounting of how today’s system is performing:
- County population has grown by more than 10 percent since 2001 (the year VTA’s ridership peaked), but transit ridership has dropped by 23 percent over the same time, from 57 million annual trips to 44.1 million. (Light rail ridership is growing while bus ridership is declining. This is probably a reflection of the increase in light rail service hours and the decline in bus hours.)
- The amount of transit provided has decreased by 20 percent since 2001 (from 1.65 million hours of service per year to 1.32 million hours of service), even though overall transit spending bounced back after the recession.
- VTA’s operating expenses, measured by cost per hour of service, have increased by 15 percent: 4 percent for bus service and 50 percent for light rail service. As Walker explains, “though VTA’s operating expenses have been stable when adjusted for inflation and are now growing, this funding base is buying fewer revenue hours. In turn, it is less able to address the changing travel needs of people in Santa Clara County as the population and economy continue to grow.” (p.13)
How Much Transit Service Do Comparable Agencies Provide?
Cumulative Change in Total Revenue Hours
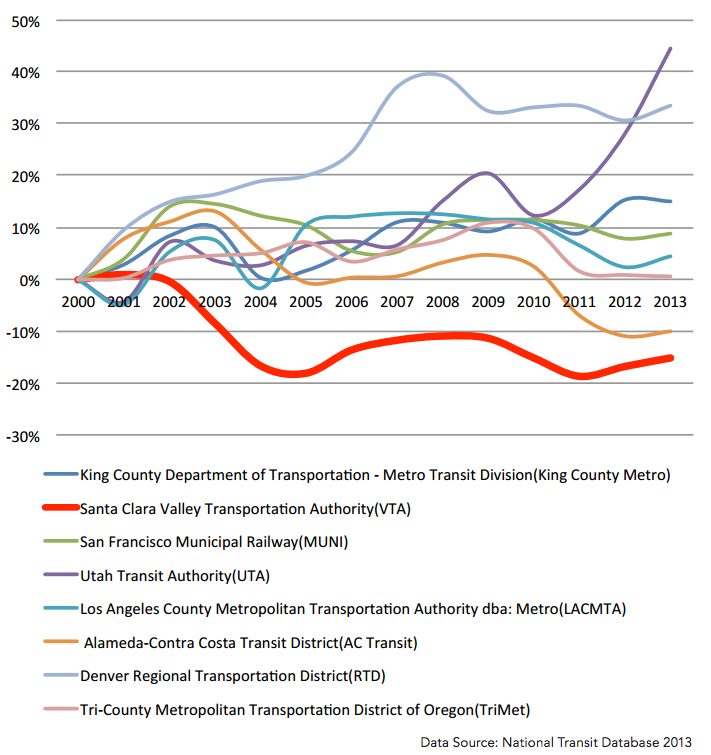
Revenue hours measure the number of hours that bus and light rail service are available to riders. The amount of service provided by VTA has decreased by 20 percent since 2000, while population in the county has grown 10 percent. Most peer agencies have been growing the amount of transit provided over the same time period. Source: Transit Choices Report.
Transit Choices and Transit Outcomes
Based on the report findings, VTA has four big choices to grapple with:
1. How should we use resources for ridership and for coverage?
Some transit services come often and carry lots of people between busy places; some travel infrequently to places with few people. The Transit Choices Report emphasizes the need for a clear distinction between transit services that are geared towards high ridership (the former) and those that are geared toward greater coverage (the latter). Walker states that frequent services (those that run every 15 minutes or less) tend to produce more ridership per revenue hour, even though they also have the highest cost. VTA gets its highest ridership on high-frequency lines that serve dense, mixed-use places.
The study also reveals important gaps in VTA’s frequent network. As Walker points out, transit is useless unless it connects riders to many possible destinations, and yet “most VTA routes are too long, and too hard to run reliably, for precise timing of connections to be available” (p.32). VTA’s network lacks frequent north-south crosstown service in the western part of the county and does not adequately connect East San Jose residents with a sufficiently wide range of opportunities (p.39).
Walker suggests that VTA focus on a high frequency grid network. Today the county has a mostly radial network, where most bus and light rail lines converge in downtown San Jose. (See figure below.) This means riders using bus services on El Camino Real, Stevens Creek Boulevard and Bascom Avenue must first travel into downtown before they can connect to frequent services to other areas. If the South Bay were to instead focus on strengthening its grid network (where parallel east-west routes and north-south routes intersect across the region), frequent lines would meet each other in many places, rather than just downtown.
Two Types of Transit Networks
![]()
Radial networks focus on delivering riders to a single downtown hub, while grid networks serve multiple activity centers. San Clara County has a mostly radial network, but a grid network may be better for South Bay transit riders who need to get to dispersed activity centers. Source: Transit Choices Report.
2. Should we add new transit at peak hours — or all day?
VTA has designed its transit network to serve riders well from Monday through Friday and during traditional morning and evening peak hours. However, boardings are telling a different story. Transit demand peaks in the afternoon, rather than during the typical rush hour. This pattern is likely because VTA’s primary market is people who are not traveling for traditional office jobs.
VTA’s ridership shows very small peaks: there are only about 10 percent more riders during peak hours than in the middle of the day. This means VTA could increase its productivity by moving some service off of the peak times and adding it to other parts of the day, when there is an underserved market.
What Time of Day Do Most VTA Riders Travel?
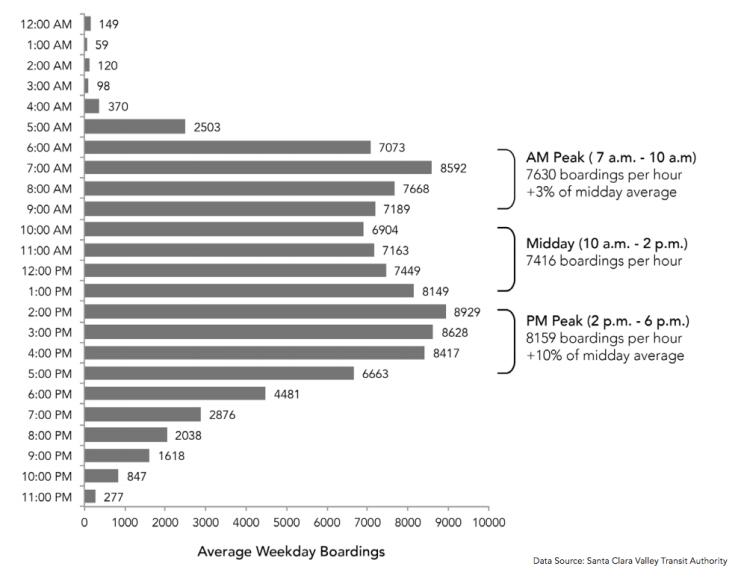
VTA’s riders travel all day, with the most riders per hour in the afternoon. However, VTA’offers less bus services during that period than it does during the traditional 5 p.m. or 6 p.m. rush hour. Source: Transit Choices Report.
3. Should we focus on familiarizing riders with the frequent network?
Today VTA markets its services using multiple categories that loosely relate to frequency (Core, Community, Local, Express, etc.). But the agency might benefit from focusing its efforts on the frequent network — services that run every 15 minutes or less all day — by emphasizing them in maps and in marketing. A similar approach has been used in Los Angeles and Houston (which Walker helped redesign in 2015). As the report states, “Service branding helps makes bus service clearer, thus reducing one of the biggest negatives that people cite about buses as opposed to trains — that they are just too complicated and uncertain.”
Another key to making the frequent network useful is having free transfers between buses. If the network design encourages transfers, then the fare structure shouldn’t penalize people for making them. Today, passengers without fare passes pay $2 for transfers, which works at cross purposes with a grid-type network concept. The Clipper card could be a way to deliver free transfers.
4. How can cities make transit work better?
Walker explains the many ways that transit success is in the hands of cities: The design of streets, buildings, parking policies and land use patterns are all municipal decisions. “The key features of the built environment that govern transit demand are obviously not in VTA’s control,” Walker writes. “They are the result of decision by past generations, and to the extent that they can still be changed, the power to do so lies with the municipal governments within the county.” We don’t have to wait a generation to see improvement. Transit travel times and reliability can be dramatically improved with simple changes to street design and traffic signals.
Four Ways Places Can Create High Transit Ridership
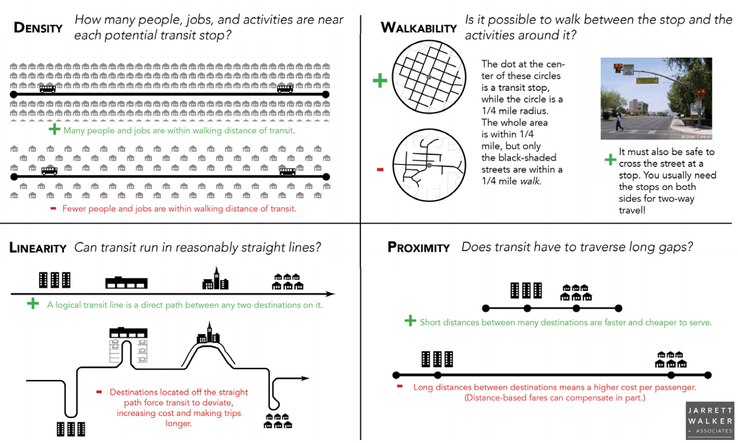
The way buildings, parking and streets are designed shapes transit ridership. Source: Transit Choices Report.
What’s Missing
There are a few important issues not discussed in the report that deserve more in-depth study as part of the Next Network development:
- The implementation of bus rapid transit on Alum Rock Avenue, El Camino Boulevard and Stevens Creek Boulevard. These three corridors were identified for bus rapid transit (a fast and frequent bus service) because of high ridership today and anticipated job and housing growth. As of March 2016, construction of the Alum Rock Avenue project is stalled, the El Camino project has been reduced to a pilot project (see SPUR’s letter), and the Steven’s Creek project is now a rapid bus service to be launched in 2017, rather than full bus rapid transit.
- The role of private transit. The report focuses on the countywide public transit network. As a result, its analyses do not include private or quasi-public transit (like employer-provided shuttles and local circulator shuttles). A closer look at private transit may present opportunities to connect riders with VTA’s network and also help cities grow all types of transportation options. Research is showing that users of private transit are users of public transit.
- Seamless trips across agencies. SPUR’s 2015 Seamless Transit report and Walker’s explainer on seamlessness highlight the importance of riders having one transit experience, rather than multiple disjointed ones. VTA transit riders could make better use of AC Transit, Caltrain, BART and Samtrans services if these agencies could use one regional transit fare and make their information more unified. Though many years from completion, BART Silicon Valley Phase II and more frequent Caltrain service will add new all-day rapid transit into VTA’s network. In San Francisco and Oakland today, BART works as part of an urban rail system; riders with a shared pass transfer seamlessly between BART and local buses and light rail. VTA’s fare policies and service planning will either drive VTA riders to BART Silicon Valley and Caltrain or deter them, and vice-versa. While these projects are years out, we can start to think through this today.
This isn’t the first deep look at the VTA network — the 2007 Comprehensive Operations Analysis resulted in a Transit Sustainability Policy, Service Design Guidelines, Bus Rapid Transit Strategic Plans and a Light Rail System Analysis. 2008 was the last time the bus network was redesigned. The Next Network might be the way we finally implement these important transit plans and policies. It is similar to other major transit redesigns, such as Houston’s METRO’s New Bus Network, Muni’s Transit Effectiveness Project and AC Transit’s Service Expansion Plan.
What will make this effort fundamentally different is if we all — civic leaders, elected officials, business leaders, planners and most of all, transit riders — understand the choices ahead and stay focused on the value of the entire transit network.
Learn more and read the Transit Choices Report >>
Attend a public meeting on the Next Network >>