Wage data from the past decade is providing some welcome news for low-wage workers. In addition to unemployment dropping to a 50-year low, wages are finally increasing faster for low-wage workers than for higher-wage workers. These findings confirm some of the analysis and recommendations we made in the Bay Area’s Economic Prosperity Strategy, which SPUR and the Center for the Continuing Study of the California Economy and other parters released in 2014. We projected that middle-wage jobs would grow slowly while the region would continue to see larger increases in both low- and high-wage jobs.
Now, as part of the SPUR Regional Strategy, we are looking at past trends and future projections to help inform SPUR’s recommendations for creating a more livable, equitable and sustainable future for the Bay Area and Northern California. (For data sources, see our note at the bottom of this article.) This article reviews wage and employment data over the past 10 years to see how recent trends might help in planning for the future. It looks at what types of jobs are growing and how low-wage jobs are faring relative to jobs at higher wage levels. A related article explores projections for the future and impacts of the upcoming retirement wave.
This article highlights two key findings from recent data:
- Low-wage jobs remain a big share of the employment landscape, while middle-wage job growth disappeared during the past 10 years.
- Minimum-wage increases have had a noticeable impact on wage gains at the lower end of the income spectrum since 2015.
The following article includes data from several eras: the current boom (2010 to today), the Great Recession (2007 to 2010) and the dot-com recovery (2001 to 2007).
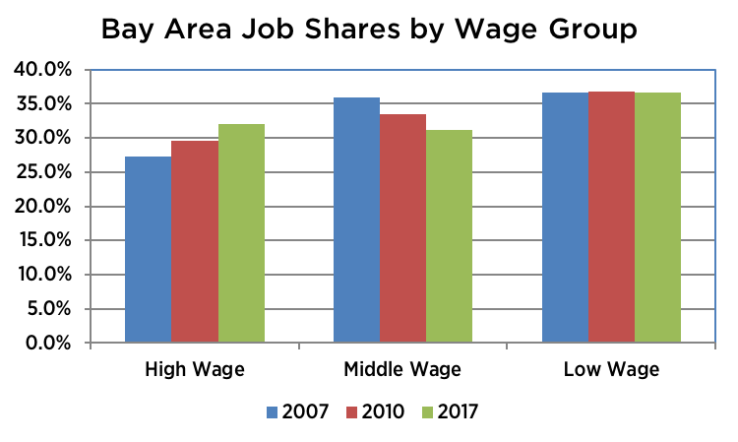
Finding No. 1: Low-wage jobs remain the largest share of jobs, while the share of high-wage jobs increased and the share of middle-wage jobs fell.
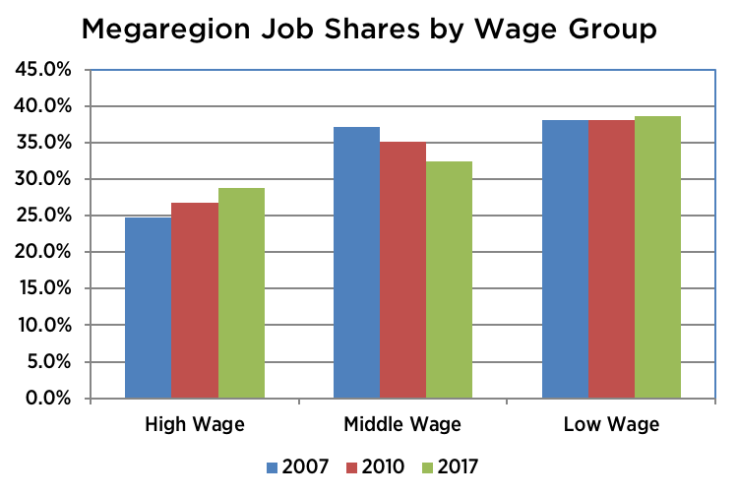
Between 2007 and 2017 the share of jobs in middle-wage occupations (defined in our Economic Prosperity Strategy as those paying $18 to $30 an hour in 2013) declined to below one third of jobs in the nine-county Bay Area as well as in the surrounding 12 counties that make up the rest of the core Northern California megaregion (the Greater Sacramento, Northern San Joaquin Valley and Monterey Bay areas). Low-wage occupations remained the largest share of jobs, at 37 percent of total jobs throughout the decade. High-wage jobs increased from 27 percent of total jobs in 2007 to 32 percent in 2017 in the Bay Area and posted smaller gains in surrounding counties.
The overall megaregion results followed the Bay Area pattern as roughly 70 percent of megaregion jobs and 80 percent of megaregion job growth were inside the nine-county Bay Area. One difference is that the 12 counties of the megaregion outside the Bay Area have a lower share of high-wage jobs and higher shares of middle- and low-wage jobs compared to the Bay Area.
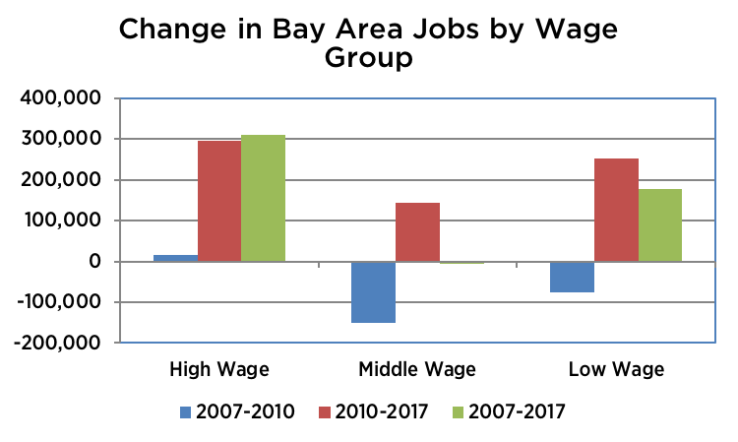
The total number of middle-wage jobs did not change between 2007 and 2017. Losses in the office/administrative and construction sectors offset small gains in the arts, community organization and installation/repair sectors. More than half of Bay Area job growth in these years was in high-wage occupations, with the remaining growth in low-wage sectors.
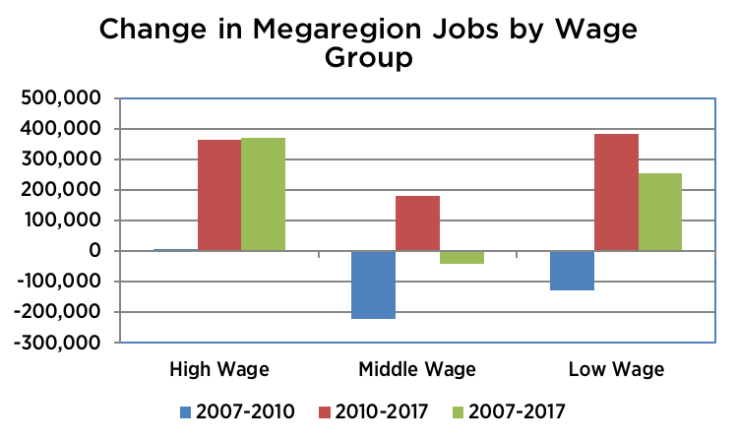
The same pattern of job growth occurred in the megaregion with the number of middle wage jobs actually falling slightly.
Finding No. 2: Recent minimum wage increases have led to faster wage growth among low-wage workers.
Since 2007, median wage growth overall has trailed inflation in the Bay Area. This was attributable to trends in the 2010–2017 recovery years and was primarily the result of rapid growth in the Bay Area Consumer Price Index (CPI) compared to wage growth.
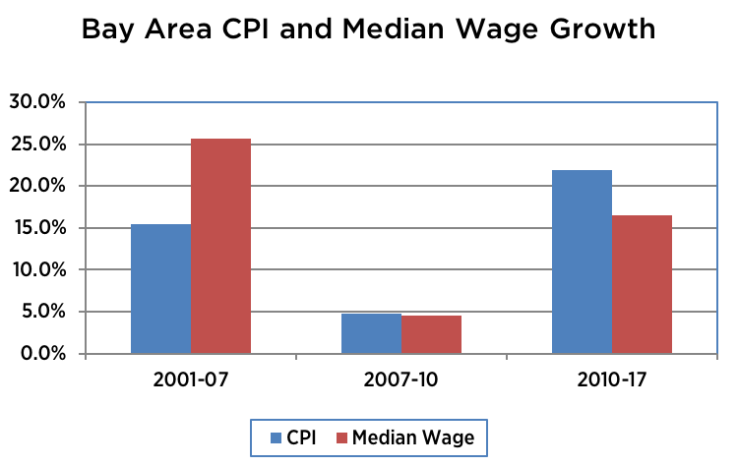
Median wage growth did outpace inflation in the 2001-2007 period as overall inflation factors were low in that period.
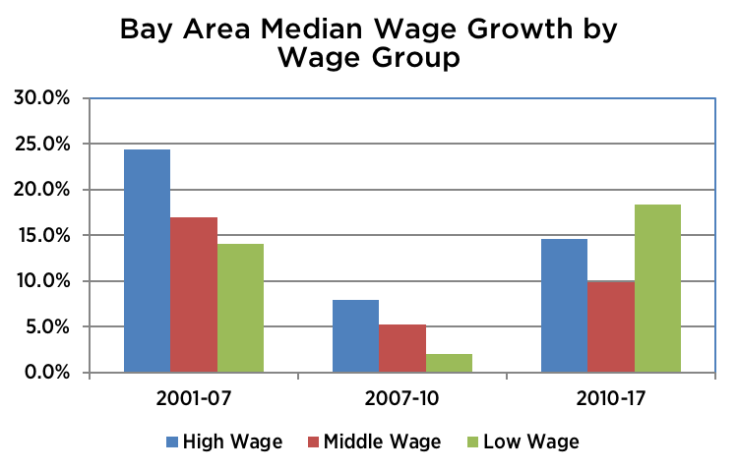
When looking specifically at wage gains among low, middle- and high-wage workers, high-wage workers overall grew the fastest since 2001. However, since 2010, low-wage workers saw their wages grow fastest. This reflects the direct impacts of the approval of state and local minimum wage increases. The state minimum wage increased from $8 per hour in 2008 to $9 in 2014 and to $12 in 2019. Low-wage workers earning higher than the minimum wage benefit, too, as wages are often pushed up slightly for those earning just above minimum wage. Despite these increases, the recent gains did not fully offset earlier periods of slow wage growth, thus low-wage workers’ wage increases since 2001 are lower than high-wage workers’ gains.
The table below shows the percent wage growth for selected occupational groups between 2015 and 2018. Workers in food-serving occupations saw their wages grow by more than 26 percent over those three years, while workers in building and ground cleaning and maintenance had wages grow by 15 percent. Over the same time frame, wage growth in high-wage occupations such as engineering, management and computers ranged from about 1 percent to under 6 percent.
Hourly Wage Trends and Percent Wage Growth in Selected Bay Area Low- and High-Wage Groups
| Low-Wage Groups | 2018 | 2017 | 2016 | 2015 | 2015-18 | |
| Healthcare Support Occupations | $19.54 | $18.97 | $18.30 | $18.16 | 7.6% | |
| Food Preparation and Serving-Related Occupations | $13.45 | $12.85 | $11.69 | $10.67 | 26.1% | |
| Building and Grounds Cleaning and Maintenance Occupations | $16.18 | $15.42 | $14.44 | $14.07 | 15.0% | |
| Personal Care and Service Occupations | $12.73 | $13.14 | $12.79 | $12.19 | 4.4% | |
| Sales and Related Occupations | $17.98 | $17.09 | $16.47 | $16.66 | 8.0% | |
| Production Occupations | $18.41 | $17.71 | $17.46 | $17.20 | 7.0% | |
| Transportation and Material Moving Occupations | $18.16 | $17.43 | $16.83 | $16.36 | 11.0% | |
| High-Wage Groups | ||||||
| Management Occupations | $68.11 | $67.93 | $67.03 | $65.39 | 4.2% | |
| Business and Financial Operations Occupations | $41.90 | $41.87 | $41.93 | $40.22 | 4.2% | |
| Computer and Mathematical Occupations | $57.06 | $56.24 | $56.50 | $54.05 | 5.6% | |
| Architecture and Engineering Occupations | $50.59 | $50.60 | $50.88 | $50.01 | 1.2% |
Similar trends were found in the 12 megaregion counties outside of the Bay Area. In particular, wage growth in low-wage occupations was driven by minimum-wage increases combined with a strong economy. The gains in median wages for low-wage occupations did move some workers up within the low-wage pay range and did reduce poverty slightly, though they did not move these workers into middle-wage jobs or keep pace with rising housing costs.
Adopted increases in the minimum wage in coming years will move more workers upward within the low-wage pay range and reduce poverty rates using the federal poverty measure. But these increases will still leave low-wage workers and many other residents struggling with high housing costs.
Census Bureau poverty estimates show the dilemma of rising wages not keeping up with housing costs. For California, the poverty rate adjusted for housing costs is 19 percent compared to 13.3 percent when housing costs are not accounted for.
Notes on the data:
This article summarizes results from research prepared for SPUR on workforce trends in the Bay Area and surrounding Northern California megaregion. The Bay Area data is for the nine-county Association of Bay Area Governments planning region. The overall 21-county megaregion includes the six counties in the Sacramento Area Council of Governments planning region plus Monterey and Santa Cruz counties in the Association of Monterey Bay Area Governments (San Benito County is included with Santa Clara County in the job and wage trend data) plus San Joaquin, Madera and Stanislaus counties in the San Joaquin Valley.
The data on job and wage trends comes from the California Employment Development Department,
The poverty estimates come from the 2017 American Community Survey (13.3 percent estimate) and the 2017 supplemental poverty measure report from the 2017 Current Population Survey (19 percent estimate).
Stephen Levy is director and senior economist of the Center for Continuing Study of the California Economy (CCSCE) in Palo Alto. CCSCE is a private research organization founded in 1969 to provide an independent assessment of economic and demographic trends in California. See www.ccsce.com.
Egon Terplan is Regional Planning Director for SPUR. He is leading the writing on the future of the Bay Area economy as part of the SPUR Regional Strategy.