
Scientists began warning about climate change for decades before it appeared on front pages and became part of the popular lexicon. Physicists in the 1850s first observed that carbon dioxide absorbs radiative solar heat in the atmosphere and causes a "greenhouse effect," an important phenomenon that enables the earth to support life. But research in the 1970s and 1980s revealed that other gases—the byproducts of industry—contributed to this effect, and that the earth was slowly warming as their concentration in the atmosphere grew.
On a sweltering day in June 1988, climate change catapulted into politics at a U.S. Senate hearing led by Al Gore, then a senator representing Tennessee, in which now-famous NASA climatologist Dr. James Hansen testified that he was "99 percent confident" that the earth was warming. In the same year, the United Nations formed the Intergovernmental Panel on Climate Change, a scientific advisory group, to provide policymakers an objective source of information about climate change.That was more than 20 years ago.
Research over the next two decades confirmed that human activities are accelerating global warming, particularly through fossil fuel use, transportation, industry and agriculture. It also predicted dramatic worldwide impacts, including changes in hydrological cycles—causing extreme droughts, floods and fires—and changes in oceanic currents and weather patterns from rapidly melting glaciers.
FORMING A POLICY RESPONSE TO GLOBAL WARMING
Policy efforts to reduce emissions were slow to get started, for three reasons. First, a small but vocal group of climate "skeptics," supported by powerful business interests, gripped the media and tried to convince people that there was a legitimate debate about the very existence of global warming. Second, uncertainty about the scope of the problem, the international cooperation it would require to address, and how to get started, daunted even the most forward-thinking policymakers. Third, outside of the research and policy world, education efforts and citizen activism on the issue were sparse, so there was not much of a movement for change.
Global warming leaped from hearing rooms to living rooms with the release of Gore’s 2006 film, "An Inconvenient Truth," which described the growing scientific consensus that global warming was occurring at an unnatural rate. It also reached out to a wider audience with its vivid depiction of devastating storms, heat waves, water and food shortages, sea-level rises, increased disease and human mortality, and mass extinctions. In 2007, the Intergovernmental Panel on Climate Change released its fourth Assessment Report, which revealed the latest science: that changes in global atmospheric concentrations of carbon dioxide, methane and nitrous oxide were human-caused and greater than ever.1 The IPCC documented that emissions of greenhouse gases increased 70 percent between 1970 and 2004; carbon dioxide, the most important anthropogenic GHG, increased at an even faster rate. Al Gore and the IPCC shared the Nobel Peace Prize in 2007, giving global recognition to a growing crisis. At last, a public consensus had emerged to work on solving the climate crisis rather than on debating its existence.
But how? The earliest policy attempts to benchmark and reduce emissions occurred at two levels. On the international scale, the 1997 Kyoto Protocol to the U.N. Framework Convention on Climate Change set binding targets for industrialized countries to reduce emissions to an average of 5 percent below 1990 levels by 2012. Kyoto also pioneered market mechanisms such as emissions trading, and the Clean Development Mechanism, which allowed industrialized countries to offset emissions by reducing emissions in developing countries. Kyoto was widely criticized for not going far enough to stabilize GHG levels in the atmosphere, but at the same time it was an important first step to set commitment levels reflecting the greater responsibility of industrialized countries for existing high levels of GHGs. The treaty went into force in 2005, and the United States is the only signatory country that has not yet ratified it.
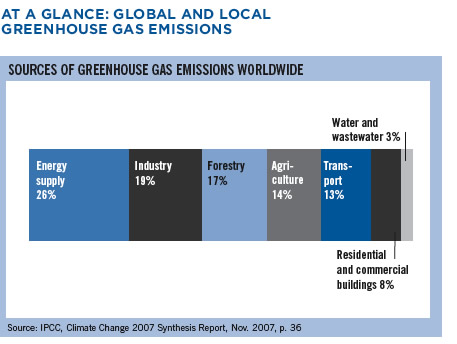
Greenhouse gas emissions worldwide are measured by economic sector. This data is drawn from the Intergovernmental Panel on Climate Change's Fourth Assessment Report, which summarizes changes in climate, causes of the observed changes, projections of future climate change and adaptation and mitigation strategies. The full report is available at www.ipcc.ch.
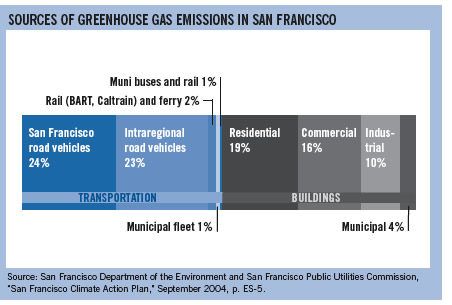
The City's Climate Action Plan breaks local emissions down into two categories: transportation and buildings. As shown here, each category makes up roughly half of the local emissions inventory. SPUR analyzed two additional sources of CO2 emissions not covered in CAP's analysis: the airport and waste reduction.
PARSING THE MANY STAGES OF CLIMATE POLICY
The second stage of climate action—and perhaps the most important one in the United States—has been at the local government level. In 1990, a U.N. conference on sustainable development brought together more than 200 local governments from greater than 40 countries, resulting in the formation of an association known as the International Council for Local Environmental Initiatives (now known as Local Governments for Sustainability). ICLEI pioneered the process for local governments to set targets and establish action plans to reach climate goals and other sustainability goals. Through tools and technical assistance, ICLEI has helped hundreds of local governments—with an estimated responsibility for 15 percent of anthropogenic GHG emissions—to commit to reducing emissions to meet or go beyond Kyoto goals.
Regional and state policy efforts to reduce emissions have also emerged in the last few years, though implementation has barely gotten off the ground. The European Union established a multinational emissions trading scheme in 2005, covering more than 10,000 major sources. Although it resulted in the creation of thousands of emissions inventories, it also has been criticized for being expensive and for not going far enough. In the absence of a national climate policy in the United States, state leaders have established regional cap-and-trade systems: the Regional Greenhouse Gas Initiative in the Northeast, and the Western Climate Initiative, which covers 11 western states (including California) and Canadian provinces. The WCI established a goal in 2007 to reach levels of 15 percent less than 2005 levels by 2020. RGGI, which covers only the electric power sector, seeks to use cap-and-trade to reduce emissions 10 percent by 2018. Its initial auction period began in January 2009.
More and more private companies are becoming aware of the growing economic risk of climate change, as well as their responsibility for action, and are beginning to inventory their emissions and set reduction targets. Covering the private sector, the Chicago Climate Exchange was established in 2003 to create a cap-and-trade system for six greenhouse gases. The exchange is a voluntary but legally binding market that facilitates carbon trading and offset projects in North America and Brazil. More than 350 participating companies have joined, committing to independent verification of emissions and to reducing emissions 6 percent by 2010.
Closer to home, the State of California adopted the Global Warming Solutions Act of 2006 (AB 32), committing California to a plan including regulatory and market mechanisms to reduce emissions to 1990 levels by 2020.2 At the end of 2008, the state adopted its scoping plan to set reduction targets for various sectors of the economy, 80 percent of which will be covered by a cap-and-trade system that will go into effect in 2012.3 Like those of its regional counterparts, California’s efforts are so new that its success cannot yet be measured. However, California’s plan is being watched closely as a potential federal model.
Given the increasing urgency with which policymakers are being called to act, growing certainty about the need to stabilize atmospheric carbon levels below 350 parts per million, and entities all over the world setting reduction targets, the question has become: how do we prioritize and take a strategic approach among so many reduction opportunities? In a 2004 Science paper, professors Stephen Pacala and Robert Socolow proposed the simple but elegant concept of stabilization "wedges": technologically feasible strategies to close the gap between business-as-usual emissions and the level necessary to stabilize the concentration of carbon in the atmosphere. Each wedge—representing a different technology such as energy efficiency, renewable energy, carbon storage, soil management and so on—could potentially reduce the equivalent of 1 billion tons of CO2. By setting priorities and ensuring the attainment of at least seven wedges, we could potentially stabilize carbon concentrations in 50 years.
Besides the technological feasibility of different strategies, cost is a concern. In 2007, the McKinsey Global Institute assessed the total GHG abatement potential in the United States that could be achieved with existing and emerging technologies that cost $50 per ton or less.4 This approach revealed that strategies vary by cost-effectiveness and by their total abatement potential. The study found that nearly 40 percent of abatement could be achieved at a negative marginal cost, meaning that investments in these strategies pay their investors economic returns over their life cycle. Examples of such strategies include improvements in the energy efficiency and lighting of buildings, more efficient appliances and fuel economy.
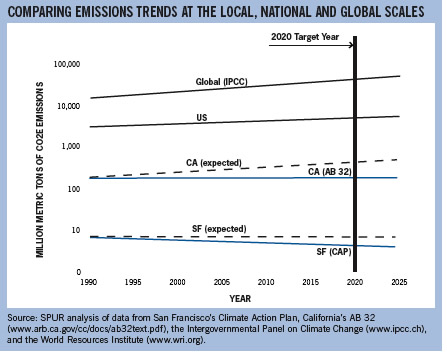
This illustration shows global, national, state and city emissions trends and projections. California, under AB 32, and San Francisco, under its Climate Action Plan, have adopted reduction goals for 2020. Dotted lines show business-as-usual projections, while solid blue lines indicate local and statewide reduction goals.
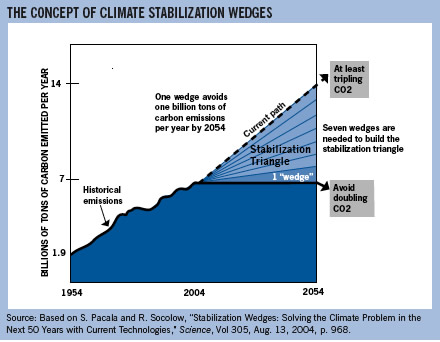
In 2004, researchers Stephen Pacala and Robert Socolow proposed the elegant concept of "stabilization wedges" as a framework for closing the gap between business-as-usual emissions and the level necessary to stabilize the concentration of carbon in the atmosphere. Each of the seven wedges could potentially reduce the equivalent of 1 billion tons of CO2.
Cap and Trade? Carbon Tax?
Regulators are increasingly using the market as a tool to achieve environmental goals. Instead of a "command and control" approach that dictates specific limits that polluters must not exceed, market mechanisms are more flexible, help to reduce total pollution for the least cost, and usually contain incentives for entities to reduce emissions beyond their requirements. While this paper focuses on more direct policy options for reducing carbon emissions locally, the market is being eyed as the most efficient tool for reducing emissions at a larger scale.
Two broad tools that are often cited as economy-wide approaches to controlling GHG pollution are carbon taxes and emissions trading, or "cap and trade." Both approaches can be economically efficient, but have their downsides as well. Emissions trading works by a regulatory authority setting the desired quantity of pollution (the so-called "cap," allocating emissions permits based on historic emissions or by auction) and setting up an enforceable marketplace among the covered entities. In this type of system, the price of allowances is uncontrolled, which can be expensive for firms. However, the total annual emissions can be tightly controlled, which is a benefit to policymakers seeking to reach specific targets. An effective cap-and-trade setup reduced sulfur dioxide emissions, the cause of acid rain, in the Northeast United States following the Clean Air Act amendments of 1990.
A carbon tax, on the other hand, has price certainty for firms and a revenue stream for regulators, but no guaranteed emission outcome. In this system, a cost increase to pollute may lead some firms to reduce emissions, while others will pay a tax that can be channeled into reducing emissions elsewhere. It is challenging for regulators to set the tax at a level that will change behavior, and new emission sources can come online without having to buy allowances. However, a carbon tax can be implemented in the form of a revenue-neutral tax shift, such as was recently deployed in British Columbia. There, a tax increase on all fossil fuels, including gasoline, natural gas and home heating oil, will be matched by a tax decrease on personal and corporate income. SPUR evaluated the potential for tax-shifting at the local level in a recent paper "More Work, Less Waste."
SAN FRANCISCO’S CLIMATE ACTION PLAN
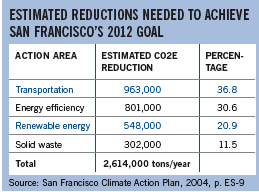
San Francisco was early to adopt reduction targets and a strategy to achieve them. In 2002, the Board of Supervisors passed a resolution committing San Francisco to reducing its emissions to 20 percent below 1990 levels by 2012—a goal even more aggressive than Kyoto. Working with ICLEI-Local Governments for Sustainability, San Francisco wrote a broad and aggressive Climate Action Plan in 2004 to meet this goal. The Climate Action Plan, written by the Department of the Environment and the Public Utilities Commission, included a baseline inventory of San Francisco’s emissions in 1990 and an estimate for business-as-usual emissions for 2012. It set numeric targets for emission reductions from transportation, energy efficiency, renewable energy and solid waste (see page 12). Overall, the City sought to reduce emissions from 9.1 million metric tons of CO2 equivalent to 7.2 MMT. The annual reductions from all sectors would need to be at least 2.5 MMT below 2000 levels by 2012.
 Besides containing an inventory and overall targets, the Climate Action Plan recommended actions, with specific targets for each category. In transportation, some of the actions included increasing transit use, increasing bicycling and walking, discouraging driving, and increasing the use of clean-air vehicles. In energy, actions included increasing energy efficiency through incentives and direct installation, expanding education and outreach, developing renewable energy projects, and increasing green power purchasing. To evaluate the potential reductions from each of these actions, the Climate Action Plan drew upon other existing City policies, such as the Electricity Resource Plan, the Countywide Transportation Plan and the Sustainability Plan. Where no published numbers existed to determine what was achievable, it clearly documented the authors’ assumptions.
Achieving this level of reduction was expected to be a stretch. The City has attempted to make inroads through diverse programs such as the Energy Watch program to improve energy efficiency, green building rules for new construction, incentives for residents and businesses to purchase solar arrays, and the "Fantastic-3" waste sorting system that has helped the city achieve one of the country’s highest recycling rates.5 The City has made efforts to improve the municipal vehicle fleet, and required City agencies to write individual climate action plans. However, these efforts have not achieved the reductions necessary to meet its goal. When the City conducted its most recent emissions inventory in 2005, the City had reached only half of its target for that year—and at least some of these reductions could not be attributed to concerted efforts on the City’s part. This meant that efforts would have to be redoubled to reach the aggressive 7.2 MMT target by 2012.
In spite of its dozens of recommendations and proposed indicators of progress, the Climate Action Plan—like most other cities’ plans—did not contain an implementation plan. It directed City departments to "next steps," most of which were good ideas but not specific enough to be actionable. Most importantly, its recommendations did not identify costs or resources for their implementation. Without funding or specific mandates, it would be challenging for City agencies and departments to implement even the best ideas.
Because of the scale of this challenge, SPUR has examined a wide range of potential actions and has developed a series of recommendations that will provide the greatest reductions of emissions for the least cost.
Public Cost Is Not the Only Way to Rank Climate Investments
SPUR has analyzed the non-cumulative effect of investments to reduce emissions of global warming gases. But the sum effect of several investments can create more behavioral change than can be predicted by looking at the effect of each individual investment. This is certainly true with regard to investment in transportation infrastructure. Transportation infrastructure is expensive, yet considering the cost of individual projects could underestimate the benefits of investments considered together. This is something to keep in mind when evaluating the wisdom of investments in transit based on one or only a few criteria, such as cost or the reduction of vehicle miles traveled.
As SPUR has written many times before, increased investments in transit networks enable people to replace car trips with other modes of travel more of the time.
SPUR has found that promoting urban land uses, where the automobile is unnecessary for everyday needs, is by far one of the most cost-effective strategies for reducing greenhouse gas emissions. With this understanding, transportation investments have a benefit beyond what’s indicated by the narrow look at the reduction in vehicle miles traveled.
SPUR’S COST-EFFECTIVENESS ANALYSIS
Just as there are costs (and sometimes benefits) to the U.S. economy for every strategy or stabilization wedge pursued, there are tradeoffs among San Francisco’s many policy options. Cost-effectiveness is an especially important test for adopting new climate policies, as the City’s budget is strained and must be utilized as efficiently as possible. Least-cost planning is an approach to setting priorities for public investments in infrastructure investments that goes beyond traditional cost-benefit analysis to include life-cycle cost accounting, and social and environmental costs. It also evaluates sets of options together to arrive at an optimal set of coordinated policy strategies.
To support San Francisco in meeting its emissions targets, SPUR assessed potential climate change actions at the city level based on their cost-effectiveness: the cost being that borne by the public in terms of the City budget, and the benefit being the tons of carbon reduced. We also factored least-cost planning principles into our analysis, considering life-cycle costs for investments as well as social and environmental impacts.
We analyzed 42 options to reduce emissions in the transportation, energy and waste sectors, and considered but rejected—or could not analyze—dozens of other ideas. We estimated how much it would cost the City to reduce one metric ton of carbon dioxide through each option. We also estimated how many tons of carbon each option could potentially reduce on an annual basis and the year each option could begin delivering reductions. In developing these estimates for each option, we used published and available numbers where possible, comparative data from other cities if available, and our best professional judgment where these sources were not available. We brought together small task forces to create the lists of options to study for each sector, as well as to review our estimates and calculations.
Energy Analysis Assumptions
When SPUR set out to analyze San Francisco’s options for addressing its climate change and emissions reduction goals, most of the energy policies we reviewed included assumptions about average household energy use in San Francisco. We used the assumptions from an energy simulation website of the Lawrence Berkeley National Laboratory: 6,600 kilowatt-hours of electricity per year, and 530 therms of natural gas. To calculate the carbon content of PG&E’s energy mix, we use the estimates provided on PG&E’s website: 0.524 pounds of CO2 per kilowatt-hour, and 13.445 pounds of CO2 per therm of natural gas.
Many energy policies involve small public investments in program management or enforcement that leverage substantial private savings after an initial period of debt. We used life cycle analysis to calculate the total public cost for each ton of carbon dioxide reduced by a given practice or policy. Our analysis presumed that most energy efficiency measures have a life cycle of 10 years; renewable energy investments have a life cycle of 25 years.
References to “tons” in this report are synonymous with metric tons — equivalent to 2,205 pounds. This is the standard unit of measure for greenhouse gas emissions.
In this report also estimate how long it would take each policy option to begin reducing emissions , rounded to the nearest five years – a point in time called the “horizon year.”
Transportation Analysis Assumptions
When a project or policy has been through a formal environmental review, this analysis uses the estimates of emissions and costs that have been calculated in that environmental document. Otherwise, SPUR’s analysis of automobile vehicle miles traveled, and the amount of carbon dioxide emitted, is based on the assumptions that 19.56 pounds of carbon dioxide are produced by each gallon of gasoline burned and that vehicles can travel 25 miles per gallon of gas.
Many analyses of transportation emissions are calculated as daily figures for a typical weekday. Unless otherwise specified, SPUR’s analysis of transit assumes that annual emission totals are 300 times the daily figure – in other words, equivalent to 300 days of the daily emission level. SPUR’s analysis of emissions related to the use of freeways assumes that annual totals are 360 times the daily figure. Where policies apply only to weekday travel, we assume that this works out to 255 weekdays per year.
Except where otherwise noted, for San Francisco’s major capital projects of the Central Subway and the Transbay Terminal/downtown extension of Caltrain, this analysis converts capital costs to annual amounts by assuming that these costs will be financed at a rate of 5 percent over the course of 30 years.
As with our energy analysis, we estimate for each transportation policy option the horizon year – the time when the implementation of these policies realistically could start reducing emissions, rounded to the nearest five years.
42 Options for Reducing Local Carbon Emissions
SPUR's analysis of options in three areas — energy, waste and transportation — revealed intriguing results about each policy options public cost per ton and total carbon abatement potential. Measures marked with two asterisks (**) reduce emissions regionally (beyond San Francisco).
ENERGY
| OPTION | POTENTIAL CARBON SAVINGS (Metric Tons) | PUBLIC COST PER TON (Dollars) | OTHER IMPORTANT CONSIDERATIONS (Equity Issues, Co-benefits, etc.) |
Efficiency Retrofits | |||
| Update the Residential Energy Conservation Ordinance (RECO) | 6,200 | Less than $5 | Private Savings, Private Cost |
| Update the RECO and require home performance testing | 12,400 | Less than $5 | Private Savings, Private Cost |
| Require retrocommissioning in commercial buildings | 18,300 | Less than $5 | Private Savings, Private Cost |
| Reinstate the Commercial Energy Conservation Ordinance (CECO) | 24,400 | Less than $5 | Private Savings, Private Cost |
| OPTION | POTENTIAL CARBON SAVINGS (Metric Tons) | PUBLIC COST PER TON (Dollars) | OTHER IMPORTANT CONSIDERATIONS (Equity Issues, Co-benefits, etc.) |
Financing
| Expand energy efficiency rebates and installation services | 4,900 | $130 | Private Savings |
| Create a loan program to finance comprehensive energy efficiency services | 16,700 - 33,500 | Less than $5 | |
| Create a "green lease" program | 200 | $40 | |
| Expand solar PV incentives for municipal or private installations | 500 | $250 | Reduces Energy Demand |
| Expand small-scale wind | 200 | $900 | Reduces Energy Demand |
Grid Efficiency
| Build smart grid infrastructure | 137,800 | $10-90 | Reduces Energy Demand |
Carbon tax
| Impose a carbon tax (utility users' tax) | 35,000 | $890 | Public revenue, Private cost, Equity issues |
WASTE
| OPTION | POTENTIAL CARBON SAVINGS (Metric Tons) | PUBLIC COST PER TON (Dollars) | OTHER IMPORTANT CONSIDERATIONS (Equity Issues, Co-benefits, etc.) |
Waste Reduction | |||
| Require recycling and composting | 186,700 | Revenue neutral | Private Savings |
| Build food scrap digesters to produce eergy from compost | 25,300 | NA | |
DECREASE VEHICLE MILES TRAVELED (VMT)
| OPTION | POTENTIAL CARBON SAVINGS (Metric Tons) | PUBLIC COST PER TON (Dollars) | OTHER IMPORTANT CONSIDERATIONS (Equity Issues, Co-benefits, etc.) |
Improve Transit | |||
| Implement the TEP recommendations for Muni | 7,200 | $450 | Improves mobility |
Build and expand service
| BRT on Geary | 1,400 | $9000 | Improves mobility, Additional CO2 emissions from construction |
| BRT on Van Ness | 600 | $5,500 | Improves mobility, Additional CO2 emissions from construction |
| Build the downtown transit center/Caltrain extension** | 28,200 | $3,900 | Improves mobility, Additional CO2 emissions from construction |
| Build the central subway | 500 | $132,000 | Improves mobility, Additional CO2 emissions from construction |
| Caltrain electrification** | 48,800 | $700 | Improves mobility, Additional CO2 emissions from construction |
| Expand ferry service** | (58,000) | NA | Improves mobility, Additional CO2 emissions from construction |
| OPTION | POTENTIAL CARBON SAVINGS (Metric Tons) | PUBLIC COST PER TON (Dollars) | OTHER IMPORTANT CONSIDERATIONS (Equity Issues, Co-benefits, etc.) |
Improve bicycling
| Build the Phase 1 bicycle network | 5,300 | $220 | Improves mobility |
| Build the Phase 2 bicycle network | 47,500 | $280 | Improves mobility |
| Create bike rental or sharing system | 8,700 | ($1,400) | Improves mobility, Public revenue |
Improve carpooling
| Expand HOT lanes in Bay Area** | (67,300) | NA | Equity issues, Additional CO2 emissions from construction |
Rationalize Pricing
| Implement variable-rate road pricing | 38,000 | ($1,900) | Public revenue, Private cost, Equity issues |
| Implement climate fee on gasoline (AB 2744)** | 28,000 | ($11,400) | Public revenue, Equity issues |
| Use pricing to manage the supply of curb parking | 24,000 | ($1,400) | Public revenue, Equity issues |
Expand PAYD
| Expand Pay As You Drive (PAYD) Insurance** | 100,000 - 1,073,300 | Revenue neutral | Private savings |
| OPTION | POTENTIAL CARBON SAVINGS (Metric Tons) | PUBLIC COST PER TON (Dollars) | OTHER IMPORTANT CONSIDERATIONS (Equity Issues, Co-benefits, etc.) |
Expand car-sharing
| Set aside car-sharing parking spaces on the street (500 spaces) | 800 | Revenue neutral | Private savings |
Marketing
| Create individualized marketing programs (Travelchoice) | 3,900 | $380 | |
| Enforce parking cash-out law | 24,800 | $10 | |
| Expand use of commuter benefits by residential developers and HOAs | 3,500 | Revenue neutral | Private savings, Private cost |
| Expand use of commuter benefits by universities | 2,000 | $140 | Private savings |
| Expand commuter benefits for city workers | 1,000 | $140 | Private savings |
LAND USE
| OPTION | POTENTIAL CARBON SAVINGS (Metric Tons) | PUBLIC COST PER TON (Dollars) | OTHER IMPORTANT CONSIDERATIONS (Equity Issues, Co-benefits, etc.) |
Add housing | |||
| Permit more housing in SF, 10% over ABAG 2030 allocation** | 79,800 | Revenue neutral | |
| Adopt regional compact land use development** | 2,937,600 | Revenue neutral | |
REDUCE EMISSIONS PER MILE
| OPTION | POTENTIAL CARBON SAVINGS (Metric Tons) | PUBLIC COST PER TON (Dollars) | OTHER IMPORTANT CONSIDERATIONS (Equity Issues, Co-benefits, etc.) |
Local incentives for low-emissions | |||
| Convert the city vehicles to biodiesel | 1,200 | $100 | |
| Create greenhouse gas standard for taxi fleet | 14,300 | Revenue neutral | Private cost |
Reduce Airport Emissions
| Reduce taxing under jet power at SFO** | 100,600 | Revenue neutral | Private cost |
Street Management
| Improve signaling to reduce idling and congestion | 5,900 | $3,000 | Improves mobility |
STATE ACTIONS
| OPTION | POTENTIAL CARBON SAVINGS (Metric Tons) | PUBLIC COST PER TON (Dollars) | OTHER IMPORTANT CONSIDERATIONS (Equity Issues, Co-benefits, etc.) |
Adjust vehicle GHG standards | |||
| Impact on SF from Pavley bill, 2020 | 1,485,900 | Revenue neutral | |
| State incentives for clean air vehicles (feebates) | 6,200 | Revenue neutral | |
SOURCE: SPUR analysis
Emissions Reductions at the Regional vs. San Francisco Level
Many of the policy options we considered reduce emissions beyond San Francisco’s borders. The policies that include reductions outside the city are noted in the table above with two stars (**). They all are policies related to transportation and land use, as building energy and waste management decisions are made locally, in accordance with state law.
We included these broader-scope policies for three reasons. First, San Francisco can play a key role in making them a reality, through advocacy and good planning. San Francisco officials participate in many regional governing boards, such as Caltrain and the Association of Bay Area Governments, that oversee land development and transportation planning. We can leverage these roles to guide investments in the most cost-effective ways to reduce the regional number of vehicle miles traveled. Second, San Francisco is one of the largest transit-served job centers in the region, and our local land-use decisions and transportation investments have a significant effect on the region and its ability to reduce CO2. For example, the Transbay Transit Center and San Francisco International Airport both are within the City’s jurisdiction and emissions scope, but are key pieces of the regional transportation network. Third, according to the Climate Action Plan, almost a quarter of San Francisco’s emissions come from regional road vehicles. To reduce emissions from this sector, we must engage in planning at the regional scale.
In some ways, the "scope" of energy, waste, land use and transportation policies in our analysis is not the same. But the broader the scope or coverage of a policy—regional, state or national—the bigger the reductions in absolute terms. And real reductions, not per capita reductions or percentage reductions, are what add up to stop global warming. As noted previously, today, action at increasingly bigger scales of governance tends to be less ambitious (with the possible exception of the State of California, which has shown tremendous leadership in adopting energy standards for buildings and renewable portfolio standards for electricity production).
Renewable Portfolio Standards
California has the highest targets for the procurement of renewable energy of any state in the country. The first Renewable Portfolio Standard was passed in 2002 and is administered by the California Public Utilities Commission. It sets deadlines for retail sellers of electricity to meet procurement targets for renewable energy. Qualifying renewable energy sources include solar, wind, geothermal, biomass, and small hydroelectric generators of less than 30 megawatts. The original law set a target of 20 percent renewable energy by 2017, a target that was later moved up to 2010. In November 2008, the law was amended by executive order to set another target of 33 percent by 2020. PG&E, the electric provider for San Francisco, is subject to this rule.
California utilities are working hard but are expected to have varied success at meeting this near-term goal. In 2007, the three large investor-owned utilities provided about 13 percent renewable power. PG&E has contracted with renewable providers for more than 20 percent of its portfolio for 2010, but some of these contracts may not deliver on time. According to the CPUC, statewide project development has been slow due to a number of barriers to building new RPS-qualifying projects, including transmission availability, financing, developer issues, permitting from counties and state agencies, and interconnection to the state grid operator. The vast majority of projects are held up by transmission issues. Work is underway at the state level to address all of these barriers.
While SPUR has reviewed the benefits and public costs of local investments to reduce emissions, we have not analyzed the impact of the Renewable Portfolio Standard because the target was raised significantly during the course of our research. We also did not analyze San Francisco’s proposed Community Choice Aggregation program, which is effectively an RPS with an even higher target that would apply only in San Francisco, because barriers to the projects that serve the state grid also apply locally. Furthermore, we do not believe CCA is more likely to be successful at overcoming these problems than the state RPS. In its scoping plan for the Global Warming Solutions Act, AB 32, the California Air Resources Board stated the expected statewide CO2 savings from the 33 percent RPS at 21.3 million metric tons per year. California’s resources must be directed to focus on ensuring this goal becomes a reality.
ANALYSIS OF BEST OPTIONS
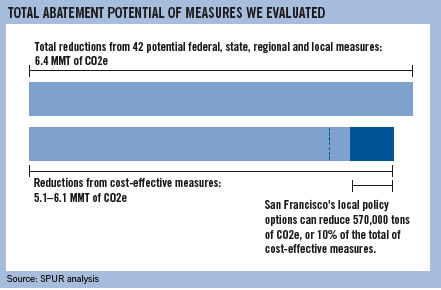
Using public cost per ton as a basis for analysis, the best options San Francisco can either implement itself or help leverage can reduce emissions by 5.1 to 6.1 MMT.6 All of these options can be implemented at zero or very low cost ($10 or less/ton of carbon reduced). Several options would actually bring in substantial revenue while also reducing emissions.
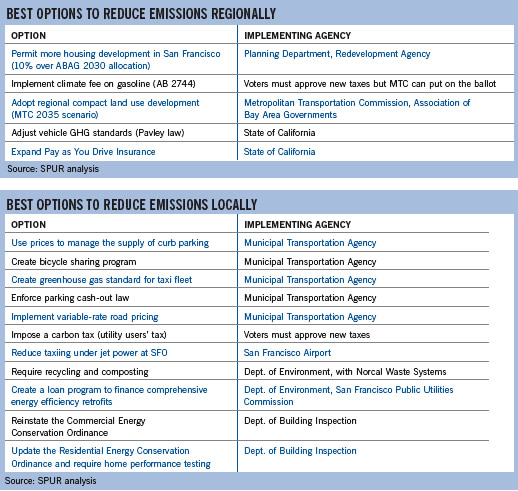
State and regionally focused policies are responsible for the vast majority of these reductions. These options cover land use planning, fuel economy and car insurance regulations. Implementation of these policies is out of San Francisco’s exclusive control, and they include reductions outside of the City’s scope as well. The City can leverage its participation in regional groups and advocate at the state level for these policy changes that will improve emissions locally. This will have the extra benefit of reducing other GHG emissions outside of San Francisco. State-level cost-effective actions include "pay as you drive" insurance, feebates or incentives for clean air vehicles, and vehicle fuel economy standards. These will reduce emissions a minimum of 1.6 to 2.6 MMT in San Francisco and the Bay Area. Regional cost-effective actions include a climate fee on gasoline sales and compact land use development, which can reduce an additional 3 million metric tons.
Of the options available to reduce San Francisco’s emissions through a city-level policy, about 570,000 tons can be reduced cost-effectively per year. Five policies stand out as the most cost-effective and significant ways San Francisco can reduce emissions at the city level: Require recycling and composting Change jet taxiing rules at San Francisco International Airport Build more than our required regional share of new housing Add more than our regional share of new jobs Use pricing to better allocate parking and roadway space However, there are several other policies that are cost-effective and contribute substantially to CO2 reduction. These are the policies that we believe San Francisco should further investigate and potentially adopt.
The City also could choose to adopt more expensive policies to meet its goal. This could have no net cost to the City if we reinvest revenue from a carbon tax or climate fee on gasoline, or if the City shifts resources currently devoted to other programs. Measures costing more than $100 per ton—or, by some estimates, any measures costing more than $50 per ton7—are too expensive to be justified solely on the basis of reducing our carbon emissions. However, SPUR believes that some of these measures will improve the quality of life and mobility in the city and the region, and has supported many of them, such as Caltrain electrification and the bicycle network, on these other important grounds.
Such measures may be expensive in terms of CO2, but they may have important co-benefits, such as economic development, air quality, livability and lower energy demand. In this study, we have tried to describe—but have not quantified—the co-benefits of each policy option. Although these co-benefits must be a part of any policy discussion, our recommendations are ranked solely on their cost-effectiveness at reducing CO2.
About 'Rebound'
In an urban environment such as San Francisco, the demand for auto travel is constrained by roadway congestion. When policies decrease driving, congestion may be reduced, and other drivers may respond to reduced congestion by making more auto trips than they otherwise might have made. This effect, known as "rebound," may reduce the emissions-abatement potential of some transportation policies described in this section. To realize the full emissions abatement benefits of certain transportation strategies, San Francisco may also have to reduce the amount of transportation system capacity available to private vehicles. Adding new bike lanes and wider sidewalks can be used to reduce single-occupancy vehicle capacity, as can parking management and congestion charges.
SPUR RECOMMENDATIONS
Recommendation #1
The City should leverage its participation in regional land use and transportation planning entities, and advocate for policy changes at the state level to achieve economies of scale in reducing emissions.
The City should work with regional planning agencies to coordinate transit, housing and other land-use plans in accordance with regional goals. In particular, adopting policies that encourage compact land-use planning at the regional scale, "pay as you drive" insurance and improved fuel economy standards can achieve reductions an order of magnitude beyond what San Francisco can do acting alone. Through the mayor and the Board of Supervisors, and our designates to regional bodies such as the Association of Bay Area Governments, the Metropolitan Transportation Commission and the Caltrain Joint Powers Board, the City should advocate for aggressive planning and regulation to reduce emissions at the regional and state levels. The City also can permit more development in San Francisco than is planned, which will reduce regional emissions due to the relatively low carbon footprint of San Francisco residents and workers.8
Recommendation #2
The City should further study and potentially adopt those options that can cost-effectively reduce emissions locally.
Many of these options result in additional private savings through energy efficiency and contribute to our urban quality of life by creating transportation improvements. The City must push for good land use in the region and seek new state regulations, while examining low-cost local options for change. Unless it advocates for changes and uses its leverage to shape broader land use and transportation policies, the City will not achieve the annual reduction of 2.5 million metric tons it seeks. In fact, even if we implement all of the locally focused options we evaluated, we still cannot meet this goal. But by working regionally and participating in broader-scale, coordinated action, we can help reduce emissions many times above the bar set by our local goal. This is a far more valuable contribution to fighting global warming.
While the groundswell of activity at the local government level was important in the early years of climate policymaking, to create a broad and resolute movement for change it may no longer be the most important scale on which to take action. Options available exclusively at the local level generally do not reduce emissions by the same order of magnitude as what can be achieved regionally through good land use and transportation planning, or even at the state or federal level. The least expensive options that require or finance energy efficiency investments, or otherwise change incentives for private citizens to save energy or reduce the amount they drive, also can achieve better economies of scale at a broader geographic scale. Local governments should coordinate to adopt land use, energy and transportation policies that make sense regionally. Local government also is a good level at which to conduct public outreach and education
CONCLUSION
Although we have known about the threat of global warming for almost a quarter century, we have still not slowed the emissions of greenhouse gases into the earth’s atmosphere. The United States has been, for most of this time, the worst offender. And yet, action at the federal level has been blocked. In response to these national policy failures, local governments in the United States began to launch their own plans to fight climate change, starting in the early 1990s. San Francisco was a leader in establishing a goal to reduce emissions, but like other cities it has found making progress on achieving the targets more challenging.
Of the many ways to reduce emissions, some clearly are more expensive than others. In a world and city of limited resources, cost-effectiveness is an essential test for assessing and setting priorities for emissions reductions strategies. The most cost-effective strategies to reduce emissions either save people money or change the pricing of public goods that we now use inefficiently. Of course, cost-effectiveness at achieving a single objective—reducing carbon emissions—is not the only basis on which to judge a transit, energy or land-use policy. Infrastructure investments, for example, might be considered higher priorities for other reasons, such as improving mobility and urban quality of life. Cost-effectiveness should be a core part of the policy-setting process on climate change, yet in San Francisco it has not been—until now.
San Francisco has a great opportunity to make a substantial reduction in CO2 emissions here and throughout the Bay Area through specific and achievable measures that change land-use patterns, make buildings more energy efficient, allocate parking and roadway space more efficiently, increase recycling, and more. The great thing is that we can do these things with minimal impact on limited public dollars. There’s no time like the present.
Endnotes
[1] Language in this report pinning climate change on human activities was the most unequivocal of any IPCC report. The IPCC wrote that "global atmospheric concentrations of CO2, CH4, and N2O increased markedly as a result of human activities since 1750 and now far exceed pre-industrial values determined from ice cores spanning many thousands of years." (Climate Change 2007 Synthesis Report, IPCC, Nov. 2007, p. 37)
[2] www.arb.ca.gov/cc/docs/ab32text.pdf
[3] http://www.arb.ca.gov/cc/scopingplan/scopingplan.htm
[4] McKinsey & Co., "Reducing U.S. Greenhouse Gas Emissions: How Much at What Cost?", The Conference Board, Dec. 2007.
[5] Some of these efforts were launched after the 2005 emissions inventory was conducted.
[6] MMT should be viewed as a maximum that would not be achieved until at least 2035. (see Figure 7). We did not analyze the effect of policies adopted together, which may increase or decrease the actual achievable emissions. For example, regional compact land use would likely add housing in San Francisco, so we would not expect to gain the potential CO2 benefits from both the local and regional land use measures. On the other hand, adjusting parking pricing, improving transit and the existence of PAYD insurance may decrease VMT-related emissions much more than the sum of these policies adopted separately might predict.
[7] McKinsey & Co., "Reducing U.S. Greenhouse Gas Emissions: How Much at What Cost?", The Conference Board, Dec. 2007.
[8] Although our analysis focused on additional housing development in San Francisco, another way to achieve emission reductions is by adding more employment in San Francisco, particularly in areas immediately adjacent to regional transit. As an employment center, 50 percent of commuters ride transit to downtown San Francisco. This is five times the regional average and far more than any other employment center. For more information, see SPUR’s March 2009 paper, "The Future of Downtown." '