Despite a deficit, Governor Gavin Newsom and legislators managed to award a significant amount of funding for transit operations in the California budget. But the state’s transit package is nowhere near sufficient to meet the Bay Area’s projected transit funding shortfalls. If left unfunded, public transportation systems will need to start making drastic service cuts in a year.
To address transit’s remaining funding gap, State Senator Scott Wiener introduced Senate Bill 532, which SPUR is co-sponsoring with TransForm, a campaigner for smarter transportation and housing policy in the Bay Area. SB 532 would generate as much as $900 million to avert transit service cuts — cuts that would keep California from slashing greenhouse gas emissions and providing access to opportunity and economic security. SB 532 would avoid those cuts while making improvements in transit safety, cleanliness, reliability, and seamlessness. These improvements would attract more riders, in turn increasing transit’s financial stability. SB 532 would generate the funds for all these benefits by temporarily raising tolls by $1.50 on seven state-owned bridges in the Bay Area for five years, starting January 2024.
The legislation has provoked significant public and political discussion about the extent to which the proposed toll increase would have disproportionate and inequitable impacts on low-income drivers. It’s reasonable to ask: In an already expensive region, is it equitable to charge more for driving?
To better understand the equity implications of SB 532 and to design potential mitigations for low-income drivers, SPUR partnered with Replica, a data platform and technology company, to analyze how people travel in the region. We sought to answer three questions: (1) What are the financial impacts of an increased bridge toll on drivers? (2) Who would benefit from the temporary increase in the bridge toll? (3) Who would be harmed if SB 532 fails?
How We Did the Analysis
To better understand how SB 532 might impact low-income drivers and to ensure that the toll is designed with equity in mind,, we need detailed and current income and demographic information about who’s driving across the region’s bridges and who’s riding transit. This Information is surprisingly difficult to come by.
The Metropolitan Transportation Commission (MTC) collects data about numbers of bridge crossings and toll activations, but it is unable to provide details on the demographics of drivers crossing bridges or on many other aspects of their trips. U.S. Census data can provide insight into the demographics of workers moving around the region, but the data are often outdated, are not specific to bridge crossings, and are focused only on typical work commute trips. Commute trips are only a fraction of overall vehicle trips, especially in the wake of the pandemic, so it’s important to look beyond commute trips for a complete picture of how SB 532 would impact people. Analyses that rely on U.S. Census data alone, like this one, therefore provide an incomplete picture.
To address this gap in data, SPUR and Replica obtained a detailed, seasonal analysis of person and vehicle movements in the built environment in the Bay Area. Replica builds a “synthetic representation” (a “replica”) of real-world movements based on an array of data inputs, including census data, traffic counts, cell phone data, credit card transactions, and other public and private sources. It then ground truths and calibrates the model to ensure accuracy. Although not based on direct survey data, the analysis Replica provides is similar to analyses based on regional travel demand models used by many public agencies for planning and policy purposes. Our analysis also includes Fastrak and toll payment data from the Bay Area Toll Authority (BATA). Together, these data sources provide insights into the benefits and burdens of increasing bridge tolls to save transit and into ways to design the toll collection system to minimize the financial impacts on low-income drivers.
Our Three Key Findings
Our analysis pointed to three surprising findings about who is driving over state-owned Bay Area bridges today and about how a temporary toll increase would impact them.
Finding 1: Bridge drivers tend to be higher income than BART riders, earning, on average, $22,000 more than BART riders. More than 40% of bridge drivers earn more than $150,000 per year.
Bridge drivers are an economically diverse group. More than 40% of drivers crossing state-owned bridges in the Bay Area on a typical weekday between fall 2019 and fall 2022 had household incomes in excess of $150,000 a year. Just 17% had household incomes below $50,000.
Incomes of those crossing bridges have increased in recent years: the median income of drivers rose from $114,000 in fall 2019 to $129,000 in fall 2022 (a rate of growth that slightly exceeded the corresponding increase in the regional consumer price index during the same period). The overall distribution of driver incomes also shifted higher during this time period, with the share of drivers from households earning more than $150,000 increasing and the share of drivers from households earning less than $100,000 decreasing.
As a whole, income levels of drivers crossing bridges also tended to be higher than those of BART riders. Bay Area Rapid Transit is the transit system serving the largest number of comparable regional trips and a likely major beneficiary of funding from SB 532.
Moreover, BART riders tended to be lower income than Bay Area residents as a whole, while drivers crossing bridges tended to be slightly higher income.
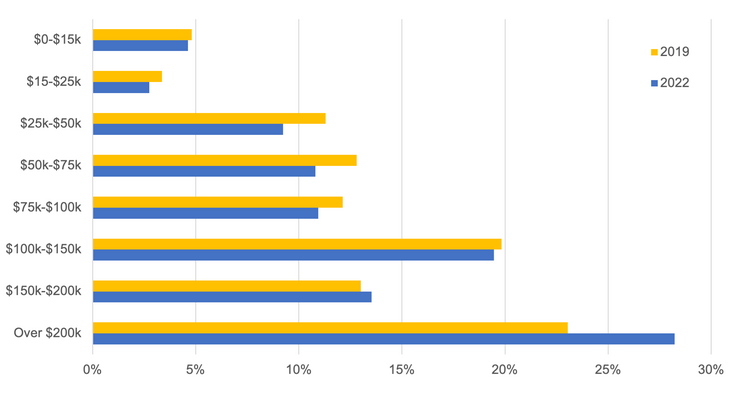
Household Income of Private Automobile Drivers Crossing the Bay Area’s State-Owned Bridges, Typical Weekday, Fall 2019 and Fall 2022
Just 17% of drivers had household incomes below $50,000. Over the two-year study period, the share of drivers with such incomes decreased, while the share of drivers making at least $150,000 increased.
What’s surprising is how pronounced the income gap is between bridge drivers and transit riders. Replica data show that people riding BART on a typical fall 2022 weekday had a median income of $107,000 — that’s $22,000 less than bridge drivers’ median income. BART riders were also more likely to come from households earning less than $50,000 a year. What these data points suggest is that SB 532 is fundamentally equitable because it is a wealth transfer from higher-income people to lower-income people.
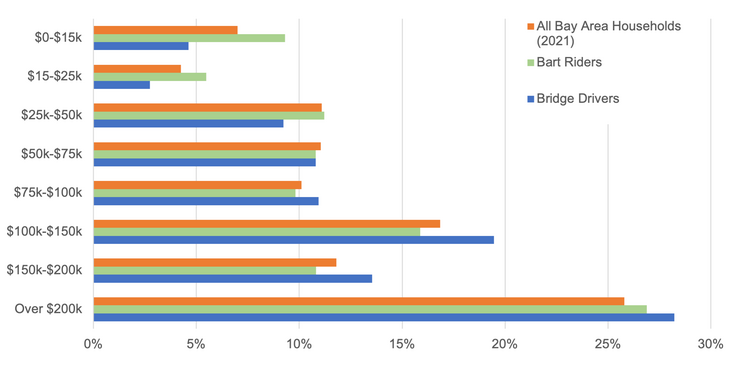
Household Income of Private Automobile Drivers Crossing the Bay Area’s State-Owned Bridges (Typical 2022 Fall Weekday), BART Riders (Typical 2022 Fall Weekday), and All Bay Area Households (2021)
Compared with Bay Area residents as a whole, BART riders tend to be lower income while drivers crossing bridges are slightly higher income.
Replica data also show that bridge drivers are highly diverse, but not more so than BART riders or Bay Area residents as a whole. A comparison of racial and ethnic identities of bridge drivers between fall 2019 and fall 2022 shows only minor changes in their racial and ethnic diversity.
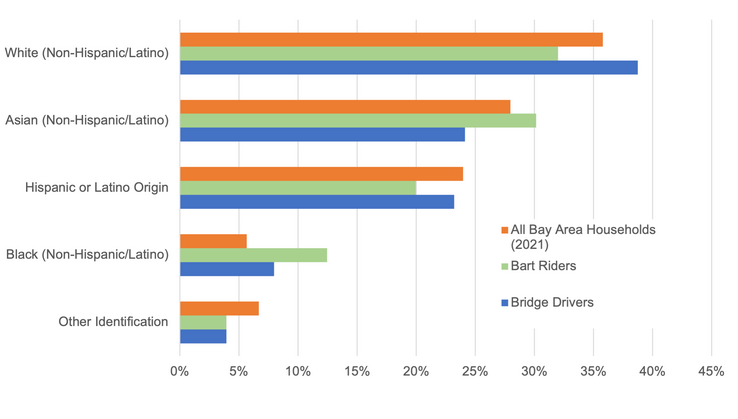
Racial and Ethnic Identities of Private Automobile Drivers Crossing the Bay Area’s State-Owned Bridges (Typical 2022 Fall Weekday), BART Riders (Typical 2022 Fall Weekday), and All Bay Area Households (2021)
Bridge drivers are highly diverse, but not more so than BART riders or Bay Area residents as a whole.
Finding 2: Commute trips make up a relatively small portion of all trips, both by bridge drivers and transit riders. However, the share of people riding BART to get to work is higher than the share of people driving over a bridge to get to work. This finding suggests the continuing importance of BART in supporting access to economic opportunity, in spite of increased remote work.
In addition to providing data on the demographics of drivers crossing bridges, Replica also provides insight into trip purpose and destinations. This information is particularly important because demographic analysis derived purely from census data accounts only for regular commutes to and from jobs — a relatively small share of the overall traffic on bridges.
People use both bridges and BART for a wide variety of purposes. Notably, as of fall 2022, the number of work trips on BART is significantly higher than work trips using bridges. The former account for 26% or as much as 52% of BART use if a return journey is assumed.
Trip Purpose Based on Destination for Private Auto Drivers Crossing Bridges and BART Riders
BART use for commutes to work is increasing. If reverse trips are assumed, the 26% of trips to work means that 52% of BART trips are work related (home to work and work to home).
|
Trip Purpose (based on destination) | All Drivers Crossing Bridges | All BART Riders | ||
| Fall 2019 | Fall 2022 | Fall 2019 | Fall 2022 | |
| Home | 37% | 35% | 36% | 33% |
| Work | 24% | 17% | 27% | 26% |
| Shop | 13% | 17% | 13% | 14% |
| Eat | 9% | 10% | 10% | 8% |
| Social | 5% | 7% | 3% | 4% |
| Recreation | 4% | 6% | 3% | 4% |
| Errands | 4% | 4% | 2% | 2% |
| School | 2% | 1% | 2% | 2% |
| Regional Departure (airport etc) | 1% | 1% | 0% | 2% |
| Lodging | 0% | 0% | 3% | 3% |
| Other | 2% | 3% | 1% | 2% |
Source: SPUR analysis of Replica Places Data
This trend is reinforced by data that detail the remote work status of bridge drivers and BART riders (not shown). Approximately 40% of bridge drivers worked in person on the modeled day, while 14% worked from home (the remainder of drivers either did not work on the modeled day or otherwise did not participate in the labor force). Conversely, 68% of BART riders on a typical 2022 weekday worked in person, while a much smaller percentage worked from home or were otherwise not participating in the labor force on that day.
Collectively, the data suggest that a minority of drivers crossing bridges and paying tolls are commuting to and from work. Conversely, the data indicate that people rely heavily on BART for work trips, especially trips for in-person work. In short, BART continues to play a significant role in supporting access to economic opportunity.
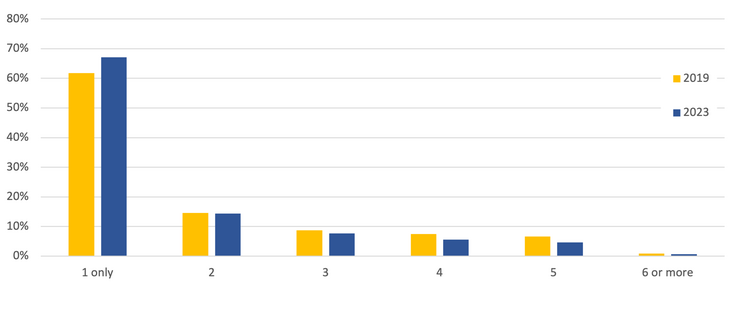
Finding 3: The vast majority of bridge drivers are occasional drivers who cross a bridge only once per week. This finding suggests that the financial impact of a new toll would be small for most drivers.
Data from the Metropolitan Transportation Commission (MTC) and the Bay Area Toll Authority indicate that a significant majority of bridge drivers (67% in 2023) cross a bridge only once per week. The pronounced drop between one bridge crossing per week and all other crossings is also notable. The data further validate the conclusion that a majority of bridge users are not regular commuters, so most people would pay only $1.50 per week in increased tolls.
Number of Weekday Bridge Crossings per Week by Individual Vehicles
The number of weekday crossings per vehicle during a given week in both 2019 and 2023 indicate that most bridge users are not regular commuters.
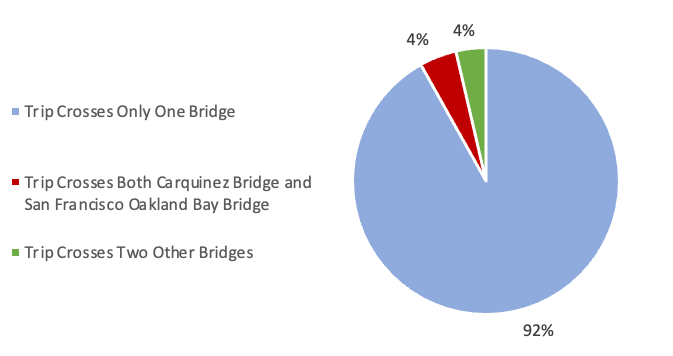
Finally, Replica data provide insight on the number of drivers who cross two state-managed bridges as part of one trip (and therefore might be subject to paying a toll increase twice for one journey). Analysis of typical weekday data from fall 2022 shows that approximately 92% of all trips on bridges involved crossing of only one state-owned bridge. Of the 8% of trips that involved the crossing of two bridges, a significant majority were trips on the Carquinez Bridge and one additional bridge; trips crossing both the Carquinez Bridge and the San-Francisco Oakland Bay Bridge account for half of all two-bridge trips.
Number of Private Autos Crossing One or More Bridges per Typical Weekday, Fall 2022
Because 92% of all trips on bridges involve the crossing of only one bridge, few people are subject to paying a toll increase twice for one journey.
Key Conclusions to Shape a More Equitable Toll Increase
Based on the analysis, SPUR believes it is equitable to enact a temporary increase in the bridge tolls to support transit riders. Transit riders are more likely than bridge drivers, and the population as a whole, to have low incomes, to be people of color, or to be members of other disadvantaged groups. According to the analysis, the financial impact for the vast majority of drivers is only $1.50 per week — a small price to pay to save transit and ensure access and mobility for all.
First, the analysis shows that drivers crossing bridges as a whole are financially better off than expected. Driver demographics are broadly comparable to the region as a whole, and driver household incomes tend to be slightly higher than those of all Bay Area residents. By contrast, BART riders are more likely to include individuals with household incomes below $50,000 a year.
Second, the majority of drivers crossing the region’s bridges are not engaged in regular, daily commuting. Most drivers cross a bridge only once a week, a large proportion of drivers are not engaged in in-person work on the day they cross a bridge, and only a minority of driver trips are anchored to a work destination.
Nevertheless, SPUR and SB 532’s other co-sponsor, TransForm, acknowledge that many bridge drivers are low income and many drivers are engaged in frequent, work-oriented trips that would require them to repeatedly pay any increase in bridge toll. Because people who are least able to pay should not be unfairly burdened or penalized for inability to pay, the toll is being designed to limit the financial harm to low-income drivers.
The data in our analysis suggest several potential mechanisms that could be used to effectively address equity concerns:
- A cap on the weekly toll increase would ensure that daily, on-site commuters are not overly burdened by a toll increase. Capping tolls at three or more trips per week, for example, would mean that no individual driver would pay more than an additional $4.50 a week, but it would still allow the toll increase to be collected for a significant majority of crossings.
- A long-distance discount would ensure that the 8% of drivers who use multiple bridges per trip would not be overly burdened by a toll increase. Drivers who cross two or more bridges in a single trip would only pay to cross one bridge.
- A means-based discount, such as a credit on a FasTrak transponder or Clipper Card, for lower-income drivers could provide targeted relief to the most vulnerable bridge users while still retaining a majority of the toll revenue associated with the increase, given that most bridge drivers are not low income.
- Low-income drivers could receive a one-time waiver of or amnesty for all toll violation debt. Further, MTC and BATA could cap the amount of money that could accrue as fines and could be required to offer a payment plan for people earning up to 200% of the federal poverty line. Holds on registrations for low-income drivers owing toll fines or fees could be prohibited. MTC/BATA currently offers means-based programs to reduce financial impacts; these programs could be extended. This package of reforms could make the toll design much more equitable to those who are least able to pay.
Each of these mechanisms has revenue implications and implementation considerations, but SPUR’s analysis of bridge users suggests that all are conceptually viable and could ensure that a toll increase is not overly impactful to those who are least able to afford the toll increase.
The Bay Area needs SB 532. If transit’s fiscal cliff goes unaddressed, the kinds of deep cuts that systems like BART would experience will be devastating to low-income users, whose access and mobility would be severely diminished. A spring 2023 analysis from TransForm found, for example, that the level of service cuts contemplated by Bay Area transit operators might force as many as 100,000 households to purchase cars. While owning a car may be convenient, it is also increasingly out of reach; the average price paid for a car is now $10,000 more than it was three years ago.
The temporary bridge toll increase can be designed fairly. When protections can be implemented for low-income drivers, there’s no reason to let transit collapse. That outcome that would be the least equitable of all.