
| What Happened: In 2013, San Francisco reached a historic peak in employment, surpassing the previous peak in 2000. | What It Means: Based on what we know so far for 2014 — employment statistics for the city have a nine-month lag — 2014 will exceed the 2013 total. In fact, during the entire period for which countylevel employment data is available, dating back to 1970, the city has never seen a more rapid three-year period of expansion in jobs than the period between 2010 and 2013. |
During what we can call the recovery period from the Great Recession, 2010 to 2013, the city added over 70,000 jobs. The 4.2 percent annual job growth rate during this period exceeded the 3.2 percent employment growth rate seen during the 1995-2000 growth period, the so-called “dotcom boom.” San Francisco’s rate of economic recovery not just unusual by San Francisco standards. During the 2011-13 period, San Francisco was the second-fastest growing large county in the United States, behind only Collier County, Texas, a suburban county outside of Dallas. The city was joined in the top ten by two other Bay Area counties, San Mateo and Santa Clara, which have also experienced strong economic recoveries.
According to the most recent county-level employment data (Figure 1), the city’s recovery continued to be broad-based through 2013. Every industry in the city added jobs on a net basis during 2013, with the exception of financial activities and traditional, non-technology-based manufacturing. While the city’s economic recovery was clearly led by the tech sector, which continued to grow by close to 16 percent during 2013, the majority of jobs created in the city have been in other industries. (See Figure 2) The tech sector accounts for approximately 34 percent of the private sector job growth in the city from 2010 to 2013.
The city’s unemployment rate for resident workers has dropped as employment has grown. Unemployment reached 10 percent in 2010, but dropped to 4.4 percent, on a seasonally-adjusted basis, by June 2014 and remained at that level at the time of writing.
The city’s unemployment rate has dropped below 4 percent during the three previous economic peaks, but only consistently reached below 3.5 percent between 1998 and 2000. In the 2008 economic peak, unemployment never reached below 3.9 percent on a seasonally adjusted basis. On past precedent, therefore, it seems unlikely that the city’s unemployment rate can continue to decline at its present rate for much longer.
Signs of a Slowdown: 2013-14
Although the city grew rapidly from 2010 to 2013, an analysis of monthly data for the metropolitan division (San Francisco, San Mateo and Marin counties) shows a clear slowdown in growth in the second half of 2013 and through most of 2014. Total private employment was growing faster than 6 percent a year through the second half of 2012 and into 2013, but has grown at less than 4 percent a year since February 2014.
As the technology industry has been the primary driver of employment growth in both the region and the city, it is not surprising that that the slowdown in total employment was proceeded by a slowdown in technology employment — albeit only from an annual growth rate exceeding 20 percent through 2012 to one between 7 and 8 percent in 2014. Monthly job data for 2014 is not yet available for San Francisco. However, the city contains 60 percent of the employment of the three-county region, and it is likely that the general trend in the city mirrors that of the region. (Figure 3)
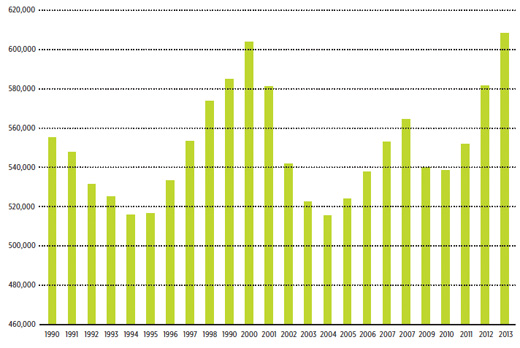
FIGURE 1: Total San Francisco Employment, 1990–2013
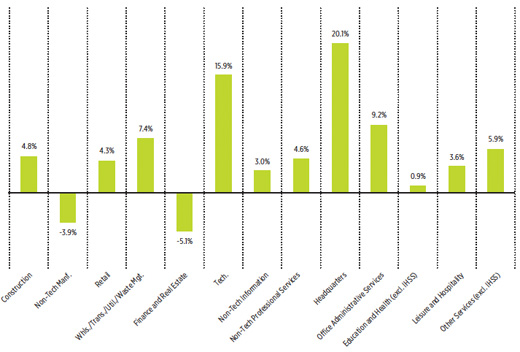
FIGURE 2: San Francisco Private Employment Growth Rate by Industry Group 2012–2013
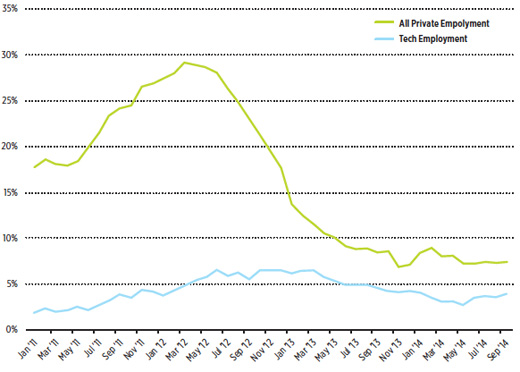
FIGURE 3: Year-Over-Year Employment Growth Rates Tech Employment and Total Private Employment January 2011 – September 2014, San Francisco Metropolitan Division
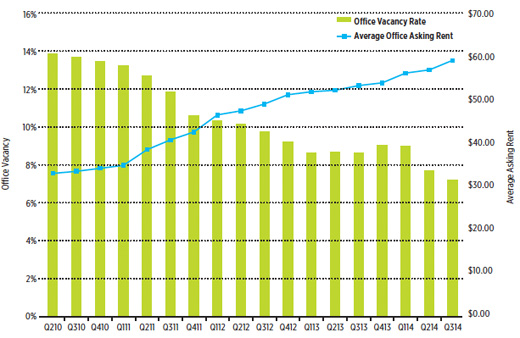
FIGURE 4: San Francisco Office Vacancy and Average Asking Rents, 2010 Q2 – 2014 Q3
A limiting factor behind the employment slowdown is available commercial space (Figure 4). Based on estimates from Moody’s Analytics, 40,000 of the 70,000 jobs San Francisco has added since 2010 have been office jobs. However, according to data provided by Cushman & Wakefield, the city has added only 1.6 million square feet of office space between 2010 and 2014 – enough to contain only 6,000 - 8,000 new jobs at typical employment densities. In this context, the commercial vacancy rate fell quickly from close to 18 percent in 2010 to below 12 percent by the end of 2012. Since then, it has fallen much more slowly, corresponding to the time of slower employment growth discussed earlier. Since commercial vacancy is unlikely to fall further (it never fell below 9 percent in the 2008 peak period, for example) and the city is supply-constrained, office availability is likely to limit employment growth for the remainder of this economic cycle.
In the context of shrinking space for jobs, it is possible that rising office rents and diminishing supply will lead a situation in which some industries grow at the expense of others, while total employment remains relatively steady. This is pattern the city has seen in past periods of economic expansion. Through 2013, the city’s economic recovery led to job growth in virtually every sector, as seen earlier. But rent pressures, even more than housing price pressures, may put an end to that pattern of balanced growth.