
"The lowest farebox recovery in the country." That was the unfortunate tag line for the Santa Clara Valley Transportation Authority through the 1990s and early part of this century. Spurred by envy of other areas' light-rail systems, the VTA made big bets on a light-rail system shaped by a politically driven agenda and a belief that riders would simply flock to whatever the VTA built.
In its early years there was a tax base to support the transit system, but with the dot-com crash and change in economic fortunes in the Valley, the continued support for a modern light-rail system became untenable. This is the backdrop of the story of transit in San Jose and Silicon Valley. Mistakes were made: There was little connection between land use decisions and transit provision. and while there was strong political support for transit, there was little public support for actually using it. Despite all the investment, the Valley continued to suffer from chronic congestion and the transit alternative wasn't viable. Transit dependent communities continued to show reasonable ridership, but to satisfy all the cities—and in the interests of perceived fairness—transit services were provided to respond to geographic equity rather than market need.
The legacy of a backbone transit infrastructure is undoubtedly a benefit. But as the City of San Jose and the VTA look to the future, there is a sober recognition that the rules of cities still apply: Transit works best when it is driven by smart land use. And however much money is invested, transit will only work if it is designed to be competitive, draws significant ridership and is driven by proactive policy decisions on land use, transportation and parking.
In recent years the area has notched some successes, particularly in the development of bus rapid transit. And Diridon Station has the potential to be one of the region's most successful transit hubs. But there is a lot of work to be done. There is no culture of transit use in Silicon Valley, and this will be the most significant obstacle to success.
The first public transit agency in the Valley was formed in the 1970s: the Santa Clara County Transit District, later to be known as the Santa Clara County Transportation Agency.1,2 Its initial purpose was to absorb three financially strapped and privately owned local bus companies and to maintain a small, but essential countywide transit service for those who did not have access to a car.
| VTA | SF Muni | San Diego | Sacramento | Portland | Minneapolis | |
|---|---|---|---|---|---|---|
| Population within service area (millions) | 1.8 | 0.8 | 2.2 | 1.1 | 1.5 | 1.8 |
| Size of service area (square miles) | 326 | 49 | 406 | 277 | 574 | 589 |
| Population density (people/square mile) | 5,546 | 16,827 | 5,469 | 3,964 | 2,555 | 2,990 |
| Light-rail network length (directional miles) | 81.0 | 83.1 | 108.4 | 73.8 | 95.9 | 24.4 |
| Annual bus trips (millions) | 33.4 | 162.3 | 49.0 | 17.5 | 64.1 | 71.6 |
| Annual LRT trips (millions) | 10.5 | 50.3 | 37.6 | 15.5 | 38.9 | 10.2 |
| Annual bus revenue-miles (millions) | 16.2 | 18.8 | 18.7 | 7.4 | 22.5 | 23.3 |
| Annual light-rail revenue-miles (millions) | 3.4 | 5.8 | 8.0 | 4.3 | 6.9 | 2.0 |
| Annual bus service (million rev-hours) | 1.3 | 2.4 | 0.0 | 0.0 | 0.0 | 0.0 |
| Annual LRT service (million rev-hours) | 0.2 | 0.6 | 0.0 | 0.0 | 0.0 | 0.0 |
| Annual bus revenue-hours (millions) | 1.3 | 2.4 | 1.7 | 0.7 | 1.8 | 2.0 |
| Annual light-rail revenue-hours (millions) | 0.2 | 0.6 | 0.4 | 0.2 | 0.5 | 0.1 |
| Source: National Transit Database 2008 | ||||||
During its early years, the agency concentrated efforts on maintaining and improving bus service. By the 1980s, many cities in the United States were planning and constructing light-rail systems, and the agency decided to aggressively pursue light rail as a way to build ridership and bring new life to San Jose's historic downtown.3 Planning for the agency's light-rail system started in 1982 and the first line, a nine-mile segment between Santa Clara and downtown San Jose opened in 1987, only seven years after Muni's first modern light-rail line became operational. By 1999, the light-rail network covered 29 miles connecting Mountain View with downtown.4 Other transit services were also developed in this period, with the Capitol Corridor service starting in 1991 and the Altamount Commuter Express in 1998.
| Average Performance Measures | VTA | SF Muni | San Diego | Sacramento | Portland | Minneapolis |
|---|---|---|---|---|---|---|
| Bus trips per revenue-hour | 25.7 | 68.6 | 28.9 | 25.8 | 34.8 | 36.0 |
| Light rail trips per revenue-hour | 52.1 | 77.4 | 85.6 | 71.7 | 85.6 | 75.8 |
| Avg. farebox recovery | 12.0% | 26.0% | 39.0% | 19.0% | 23.0% | 32.0% |
| Operating cost per revenue hour (bus) | $154.47 | $168.50 | $76.47 | $128.17 | $121.05 | $115.28 |
| Operating cost per revenue hour (light-rail) | $276.85 | $219.28 | $127.34 | $240.01 | $185.04 | $175.84 |
| Operating cost per trip (bus) | $6.00 | $1.45 | $2.65 | $4.97 | $3.48 | $3.20 |
| Operating cost per trip (light-rail) | $5.31 | $2.83 | $1.49 | $3.35 | $2.16 | $2.32 |
| Source: National Transit Database 2008 | ||||||
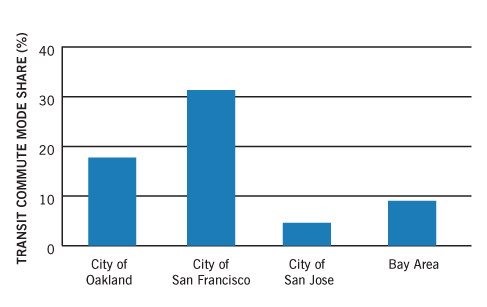
The VTA was formed in 1995 and ridership peaked in 2001, which coincided with the dot-com boom. Peak ridership was 156,000 bus and 30,000 light-rail users per weekday, but with a farebox recovery of only 13 percent. This compared with Muni ridership of 311,000 bus and 164,000 light rail users and a farebox recovery of 25 percent.5 At the same time, transit trips in Santa Clara County were only 1 percent of all trips, compared to 4 percent in Alameda and 14 percent in San Francisco.
With the dot-com crash ridership declined further and the operating budget came under significant pressure, exposing the fundamental problems inherent in VTA's operations: low ridership, low productivity, and the lowest farebox recovery in North America. This had implications not just for the VTA but for the region as a whole. Investing in and funding a transit system that didn't work meant that the underlying issues of traffic congestion and lack of mobility were not being addressed in consideration of implications for the economy and community in general.
A New Mindset
Measure A, a 30-year half-cent transit sales tax, was passed in November 2000. And while it still included investment in light-rail extensions, Measure A also held the prospect of investment in more competitive and cost-efficient bus services. At the same, the VTA was moving through programs and policies to support a new approach to transit provision. The emphasis was on building ridership from the ground up—integrating transit and land-use strategies, placing greater reliance on market research, making some tough decisions on service provision and developing more efficient services that made better use of capital and operational dollars. These programs and policies were set out in the VTA's Community Design and Transportation Program and the Transit Sustainability Policy.
The Community Design and Transportation Program was one of VTA's first steps toward critically re-examining the patterns of dispersed growth and moving toward creating places that support transit and invite pedestrian activity. The manual that emerged from this program was a best practice guide for integrating transportation and land use—particularly around bus and rail transit, and station areas. The program funded projects including the streetscape and intersection improvements along El Camino Real and at the Stanford Avenue intersection, as well as the Downtown Sunnyvale Streetscape Project.6, 7
The Transit Sustainability Policy was adopted in February 2007. The policy focused on turning VTA service into a cost-effective service that met market needs. The goal was a system-wide farebox recovery ratio of 20 to 25 percent. Service performance standards were established for various modes, to identify which mode was best suited for a given corridor or service area based on ridership, cost, land use and development patterns. This represented the first instance in which the VTA specifically defined bus rapid transit as a separate mode with its own unique operating characteristics and service parameters. They also established desired levels of development and density along the particular corridors and at stations.
VTA vs. Muni and Other Agencies
Measured against six other comparable transit agencies in the United States, including Muni, the VTA's system underperforms on ridership as well as resource efficiency. Despite having one of the most populated service areas and one of the highest population densities by service area, the VTA serves the second lowest number of bus and light-rail trips annually. From an operating perspective, the VTA serves the fewest bus trips and light-rail trips per revenue hour of the six operators, while also having very high costs per revenue hour for both bus and light rail. The VTA has the lowest farebox recovery rate, at 12 percent, and the highest cost per trip served. In addition to low productivity, the VTA's fixed transit infrastructure is poorly used: It has the lowest trip density per light-rail route-mile of the six transit agencies.
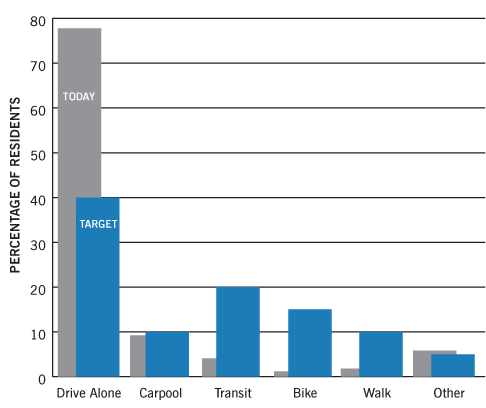
Santa Clara County is expected to add nearly 500,000 residents and 400,000 jobs by 2035. New roads will not be sufficient to meet the resulting transportation demand, and the various cities and agencies recognize this in their development plans. San Jose, for example, has targets to accommodate growth without any increase in driving, instead relying on trips shifting to transit and other non-driving modes. This represents a shift in transit mode share from 4 percent to 20 percent by 2040.
At a glance: The future regional rail network and Diridon Station hub
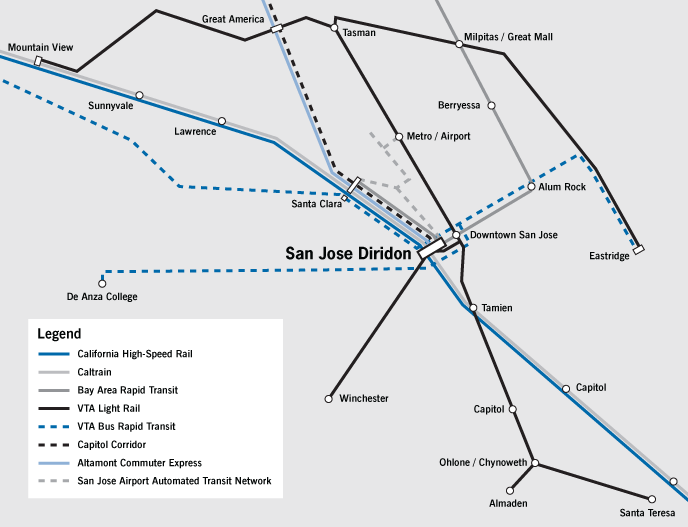
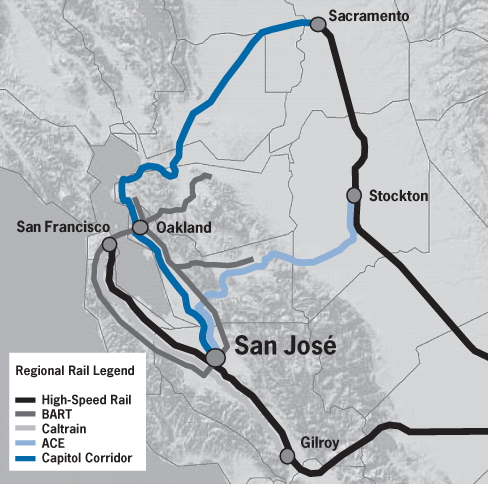
When all the pieces are finally in place, Diridon Station will be one of California's great stations and great places. Diridon will be the South Bay's answer to San Francisco's Transbay Terminal, anticipating similar passenger levels and bringing better transit connectivity to the rest of the Bay Area. Already, Diridon serves a regional transportation market and plays a role as an important transit front door for San Jose and Silicon Valley. The addition of high speed rail, BART, and an automated people mover link to the airport will transform Diridon into a significant multimodal hub, accommodating some 1,200 trains, buses, and light rail arrivals and departures, and more than 35,000 riders each day.10
As of today, it is not yet clear if San Jose will manage to get transit-supportive land uses next to the station. It may have to settle for long-planned stadiums, which will generate episodic—not consistent—ridership. That doesn't mean that the transit hub will be underused; it could mean that the problem of transporting passengers to and from the station must be overcome through shuttles, park-and-rides and other strategies.
Where to Now?
Average Light Rail Trips per Route Mile (Year 2008)
[ Click to enlarge ]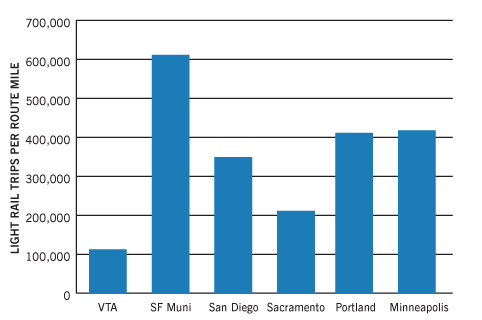
Source: National Transit Database 2008.
In San Jose today, the missteps of the past are easier to see than are glimpses of a transit supportive future. And yet it's interesting that there is BRT in San Jose but not yet in San Francisco, and that the Metropolitan Transportation Commission transit sustainability study is relying as much on input from the staff at the VTA as it is from Muni or BART. It's also interesting to see Diridon Station as a regionally significant opportunity for smart growth and transit-oriented development.
But in spite of ambitious goals to reduce reliance on the automobile, the big threats are political and cultural. How do you break the connection between car use (as distinct from car ownership) and quality of life, and how do you develop a robust and time competitive alternative to the car? The extension of BART to San Jose, the continued extensions of light rail and new BRT lines will be a test of the Valley's commitment to transit, to see whether these investments will be fully leveraged. Successful, high-profile projects will go a long way toward building a transit culture, and this will mean not simply investing in the system but supporting that investment with appropriate land-use planning and managing parking.
It remains a challenge to convince many people that taking transit is as much a part of life as taking the car. To date, the car culture has proven to be resilient—but at least now there are signs of a willingness to change.
Endnotes
- Santa Clara Valley Transportation Authority History
- McCaleb, C. S. (1994). Rails, Roads & Runways: The 20-Year Saga of Santa Clara County's Transportation Agency. San Jose: Santa Clara County Transportation Agency.
- Tennyson, E. L. (2004). San Jose's Light Rail Performance and Current Problems. Light Rail Now
- Santa Clara Valley Transportation Authority History
- National Transit Database 2001, VTA and Muni Profiles.
- Palo Alto City Clerk Reports
- Regional Transportation Improvement Program for Downtown Sunnyvale Streetscape Improvements
- Transit Operations Performance Report, 2009 Second Quarter Report (July 1, 2008-December 31, 2008)
- Comprehensive Operations Analysis, Existing Conditions Report, 2006, VTA.
- Diridon Station Area Plan, 2010