The Bay Area has more than two dozen public transit operators, but few people use more than one service and many don’t use them at all: Only 11.5 percent of commute trips in the Bay Area are made on transit. Getting more people onto buses and trains will mean overcoming the barriers to use — including making it easier for potential riders to understand what services are available and where they go. Many transit operators have good maps of their own routes (the SFMTA’s Muni System Map stands out for its useful depiction of route frequency), but they don’t typically provide enough information about other routes to facilitate a transfer. On the BART system map, for example, Caltrain and Muni are just gray lines. The region lacks a customer-oriented regional transit map that legibly displays the multiple transit services offered in the Bay Area.
Rethinking the Region’s Transit Maps
Developing a commonly used regionwide transit map was a key recommendation in SPUR’s report Seamless Transit. The Metropolitan Transportation Commission (MTC), the region’s transportation planning, financing and coordinating agency, is eager to develop a new map that integrates the Bay Area’s many public transit services so they appear as one rational, easy-to-use network. Thanks to a partnership between the Silicon Valley Community Foundation (SVCF), MTC and SPUR, this project is now underway. Over the next two years, the partners will spearhead development of MTC’s next regional transit map and facilitate collaboration among transit operators on transit mapping. Together, the group will engage in a process to understand the region’s mapping needs and determine the components of a successful ongoing mapping program for the Bay Area.
The absence of a widely used, easy-to-understand regional transit map is a real problem for the public. Today, trip-planning tools like 511.org and Google Maps help riders navigate the system, but system-wide maps are still the best way for people to discover the services available to them and build their sense of where transit goes and how to use it to get around. However, when the information presented on a transit map is inconsistent or incomplete, this confuses riders, deters potential trips and causes significant stress. Adding to the complexity, each transit agency in the Bay Area has its own apps, websites, schedules and fares. (In future posts, we’ll explore how fares can act as another barrier to transit use.) This all adds up to fewer trips taken by transit and less trust that transit is a practical option.
To Build a Better Map, First Forget Everything You Know
Mapping experts tout coherence, balance, simplicity, usefulness and harmony as some of the basic elements of a good transit map. From a cartography perspective, a good transit map simplifies the complexities of lines, creates relationships between lines and well-recognized features like landmarks, is subtle in its distortion of reality and communicates frequency. But how can we take mapmaking beyond these known best practices?
To radically rethink the way a map displays the transit network and reaches riders, our team contacted Stanford’s University’s Hasso Plattner Institute of Design, known as the d.school. The school runs a 10-week course called d.leadership: Design Leadership In Context, where pairs of Stanford students work with external clients to help them apply the principles of “design thinking” to solve thorny problems. Design thinking can best be understood as user-focused problem solving. It’s a process that prioritizes developing empathy for the user, generating ideas quickly and testing rough prototypes to fuel rapid learning. The d.school recognized transit legibility as a “thorny problem” and invited SPUR, MTC and SVCF to participate in the d.leadership course.
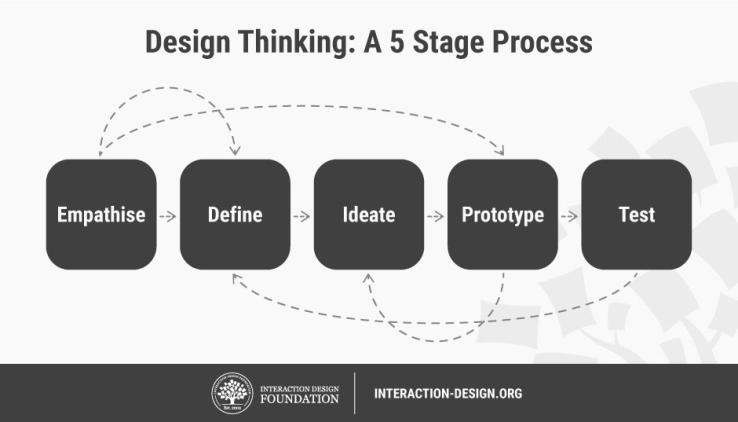
Design thinking is a non-linear process focused on developing solutions grounded in a user’s beliefs, understanding and values. Image courtesy Teo Yu Siang and Interaction Design Foundation, CC BY-NC-SA 3.0
SPUR, MTC and SVCF assembled a group of staff from several Bay Area transit agencies, including County Connection, AC Transit, VTA and Golden Gate Transit, to take part in the d.leadership course. The BAT (Bay Area Transit) Team met weekly for four hours over the course of 10 weeks at various locations throughout the Bay Area.
The BAT Team prototyped three ideas: a map that showcases the time and cost of travel, to see how people value this information; a paper prototype of a phone app that would walk people from the baggage claim at San Francisco International Airport (SFO) to the BART station and on to San Francisco or San Jose, to see how people react to receiving step-by-step information; and a team of transit ambassadors who help riders navigate connections and transit, to see if and how riders took advantage of personalized help.
![]()
Transit Ambassadors Melanie Sanborn from Golden Gate Transit and Krystal Phaneuf from VTA help a new rider find light rail at Diridon Station in San Jose. Photo by Arielle Fleisher.
When the BAT Team began the course, we assumed we were tackling a transit information problem. But what we’ve found is that information is only part of the story; just as is important is how the information is presented, and with what goal in mind.
For many people, much of the decision to use or not use transit is based on feelings of discomfort and unease. There are numerous way to address this issue, but the insights we gathered through prototyping led us to community and connection, in part because we found these to be lacking in transit. (The MARTA Army, a grassroots group of transit supporters in Atlanta, has made a similar discovery and is galvanizing support for transit through tools that foster connection). Our updated criteria for what makes a good transit map is largely an attempt to consider what it would mean to add a human dimension to the way transit information is presented.
Six Criteria for a Good Transit Map
1. Be the friend a rider turns to for help.
When we asked people to describe their first time taking transit, we often heard, “My friend helped me.” Friends show you how to load money on your Clipper Card, explain that BART lines are not referred to by their color names and teach you the difference between Caltrain’s Baby Bullet and limited service. For the new user, a friend is integral to grasping all of transit’s subtle and significant complexities. We trust the information our friends provide and know they will be there for us. What would it look like for a map to be trustworthy and reliable like a friend? Is the fondness people have for widely known, iconic maps such as London’s tube map a type of friendship?
2. Provide reassurance.
When we spent a morning at Diridon Station in San Jose acting as transit ambassadors, we found that many people, in particular those deviating from their normal route, didn’t need help so much as reassurance: I get off at 4th and King, right? The Caltrain is coming to track 5, right? This machine is for Caltrain tickets, right? At Diridon Station we met Sarah, who was making her way from San Francisco to San Jose for the first time. After we helped her connect to the light rail, she exclaimed, “It’s nice to have someone to talk to.” Similarly, John didn’t need us to show him on the map that the train went to his destination; simply telling him assuaged his uncertainty. How can we build reassurance into the regional transit map?
3. Hold the rider’s hand.
When it comes to using a map, you need to trust yourself to know how to read it. But with a tool like Google Maps, you simply hand yourself over to the blue dot. When we showed travelers at SFO our paper “app,” they liked that it helped them avoid even the potential of getting tripped up. From this we inferred that fear of messing up — reading a map wrong and getting lost — leads some to want step-by-step instructions to their destination. The positive reaction we received as transit ambassadors was further confirmation that many people want their hand held when navigating transit. Can we make a regional transit map that is as intuitive as the blue dot on Google Maps? What would it look like if the map “held” the user’s hand?
4. Be direct.
The paper “app” we prototyped at SFO had two only options, “SFO to SF” or “SFO to San Jose.” The people we talked to were drawn to the specificity the app provided: The options were presented clearly, and users saw no options other than what they needed. A central objective of a new regional transit map is to show the breadth of places Bay Area transit goes; the challenge is to do so without overwhelming people. How can we bring specificity to the design and rendering of a regional transit map?
5. Grow self-efficacy.
From our interviews, we found that when it comes to navigating transit, people have low self-efficacy — meaning they don’t believe they have the capability to perform well. Compared to ridesharing apps or a personal car — which look the same wherever you go — transit services all look different, making it easy to feel confused when using a new one. One woman we met, Christine, told us she uses transit sparingly due to a baffling experience with the ticket machine; the experience made her afraid to deviate from her normal route.
Self-efficacy is a major determinant in how people think, behave and feel in a given situation. As such, it plays a major role in how people approach goals, tasks and challenges. Developing a person’s self-efficacy may be key to encouraging transit use among people who don’t use transit or don’t use it regularly. Feedback and vicarious experience (observing events or other people) are key sources of self-efficacy. How could a map build a transit rider’s self-efficacy?
6. Be noticeable.
At SFO we met Sarit, who told us she “doesn’t notice maps.” At many rail stations, the regional transit information is placed off to the side, outside the prescribed walking path. Bus stops don’t offer regional transit information at all. Even if we design the friendliest, most assuring, most helpful map, it won’t make a difference if people don’t know where it is. Well-positioned and widespread placement of maps matters just as much as their design.
Incorporating Design Thinking in Transit
Thinking about transit users is nothing new. In the Bay Area, transit operators frequently use customer surveys, focus groups and ridership data to gain understanding of their riders. But customer surveys are measures of satisfaction, focus groups ask for reactions and data is ultimately just numbers. These tools don’t provide insight into the physical and emotional needs of riders (and those who could become riders) including how they think about the world and what is meaningful to them. This information may seem peripheral to transit operations, but it’s at the heart of why people do and don’t use transit.
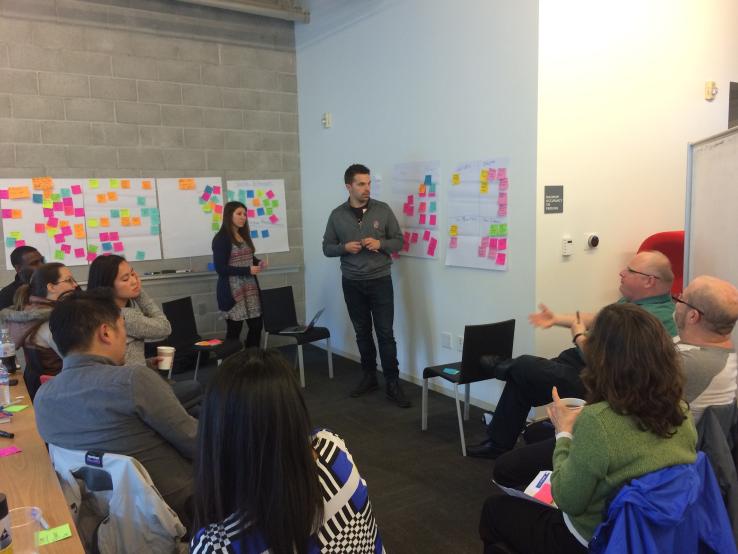
The BAT Team discusses what they’ve learned and how to incorporate the insights into future prototypes. Photo by Arielle Fleisher.
By applying the principles of design thinking and focusing on the physical and emotional needs of riders, we’ve taken the regional transit map project in a more collaborative, empathic and creative direction. But the map is just the beginning. Through the process, the BAT Team has also developed Riders Helping Riders, an initiative that crowdsources help from the people who know transit the best: actual riders. The idea grew from the insight that there’s a need to enhance the support provided to riders and that this support should be personal. We intend to build a community of riders who help other riders navigate transit through events, community meetings, social media and Riders Helping Riders swag.
On the whole, our ideas have become more insightful and powerful because they emerged not from our own assumptions but from actual riders and non-riders. Design thinking is bringing peoples’ needs and wants into the conversation and will help ensure that outcomes for the rider are what drive decision making. It’s a learning that can be applied to all aspects of transportation planning and policy.