Over the last decade and a half, San Jose’s budget has been on an economic rollercoaster. Two recessions, major budget deficits, lay-offs and service cuts have all plagued the largest city in one of the country’s richest metro regions. Even in the current boom, the city is barely in the black and has yet to fully restore all the services it cut after 2009.
Over the past few months, SPUR has been exploring some of the factors that have affected San Jose’s fiscal position, as well as analyzing how it performs financially compared with other cities in both California and Santa Clara County. For this project we are partnering with Working Partnerships USA and will release our findings and recommendations in 2016.
This blog post looks at some of our research so far. As our work progresses, we will use these and other findings as a basis for our recommendations. Above all, we are looking at how San Jose can ensure that it has the resources to deliver high-quality public services going forward.
So far we've found that San Jose’s revenues and spending per capita are below some of the state’s other major cities. While San Jose is not at the bottom on most benchmark indicators, the city lacks the resources to deliver the level of services expected for the state’s third largest city and the urban center of the South Bay.
How We Got Here
In the wake of the early 2000s dot-com recession, San Jose faced budget deficits year after year. Fearing an inability to meet future costs, the city created advisory groups and task forces to review hundreds of ideas for new revenue, cost-savings and service elimination. In 2008, San Jose released its plan to enact the 13 most promising ideas, such as reducing planned personnel raises, increasing taxes on card rooms and real estate transfers, and reducing services across the city.
And then, the effects of the Great Recession hit. As the National League of Cities shows, the 2008 recession was much worse for cities than previous downturns. San Jose’s budget deficits grew deeper, and in 2011 the city released its fiscal reform plan, outlining plans for drastic cuts in employee compensation.
Since 2001, the city has:
- eliminated 1,600 positions across administrative, community, and public safety services. (By 2015, San Jose had 5,759 positions, equal to its 1994 level, and roughly 20 percent fewer residents.)
- cut or eliminated public safety investigations, crime prevention programs, and public safety school liaisons
- eliminated a number of fire engine companies
- reduced building code enforcement and long-range city planning
- cut library hours by 33 percent and closed nearly 80 percent of its community centers
- stopped most infrastructure and road maintenance
- cut or eliminated park maintenance, street landscaping and sidewalk repairs
- cut and eliminated services to youth, seniors and people with disabilities
- lost hundreds of highly experienced staff at all levels to neighboring jurisdictions
In all, the city made cuts totaling roughly $450 million, leaving its municipal workforce and level of services far below what they once were.
In the upswing of the last few years, the city has been able to start bringing back some of these services — but not all of them. San Jose is now, in the words of Mayor Sam Liccardo, “stable but fragile.”
Do San Jose’s Fiscal Challenges Make It an Outlier?
City comparisons are important because they enable us to build a picture of what the finances of a “normal” California city looks like. Seeing where San Jose falls in this comparison gives us a rough sense of how well it performs financially compared to its peers, and perhaps how normal San Jose’s financial challenges were throughout the two recessions. The simplest way to compare cities is by looking at total general revenues sourced from property, sales and other taxes and fees, and total general expenditures, which cover core city services like public safety, libraries and roads, to name a few.
To compare San Jose’s financial picture to others, we benchmarked it against the largest cities in California and Santa Clara County. Within each grouping, we compared more than 30 general revenue and expenditure categories, using data that cites report to the State Controller.
In revenues, we find that San Jose is never the strongest, is often in the middle and in one case is dead last. In expenditures, San Jose spends less on public safety but more on other services compared to its large California city peers.
Total General Revenue Across Large California Cities
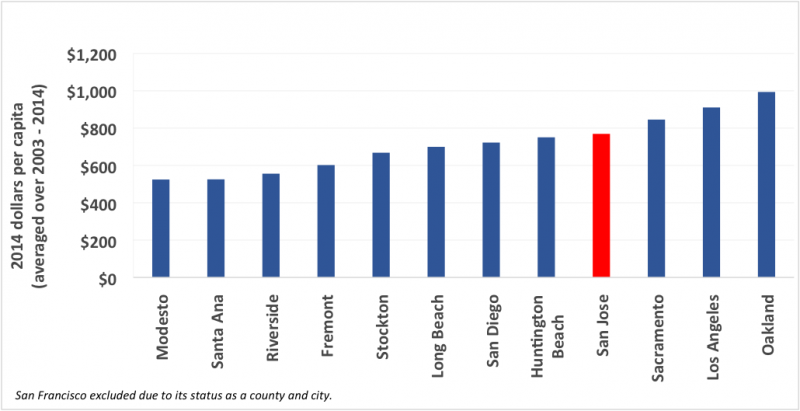
In the broadest terms, San Jose ranks fourth out of 12 big California cities in total general revenue per capita (above). Its rank is the same for total tax revenue and total general expenditures per capita — after Oakland, Los Angeles and Sacramento in both cases.
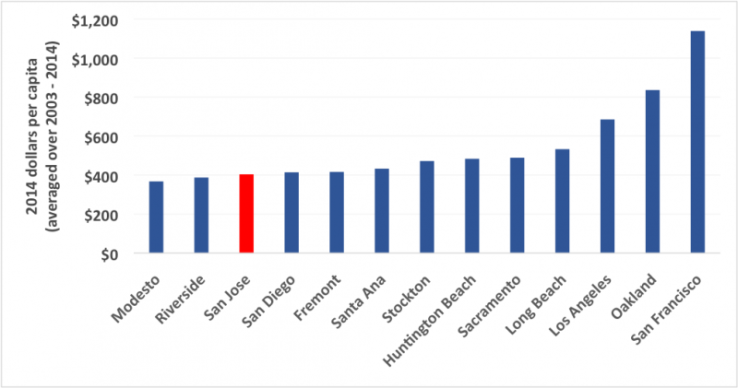
The biggest single source of general revenue across cities is property tax. In this category, San Jose drops to eighth place among big cities and is ranked sixth among the nine cities in its county. This echoes a common sentiment that Proposition 13, which froze property tax rates statewide, disproportionately affects San Jose because its sprawling residential landscape left it with a relatively weak property tax base when the rule took effect.
Property Tax Revenue Across Large California Cities
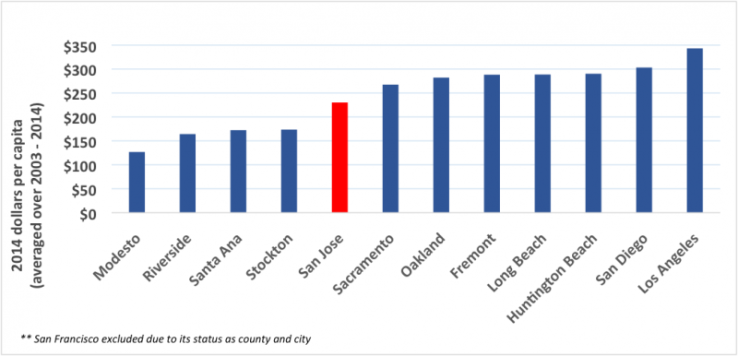
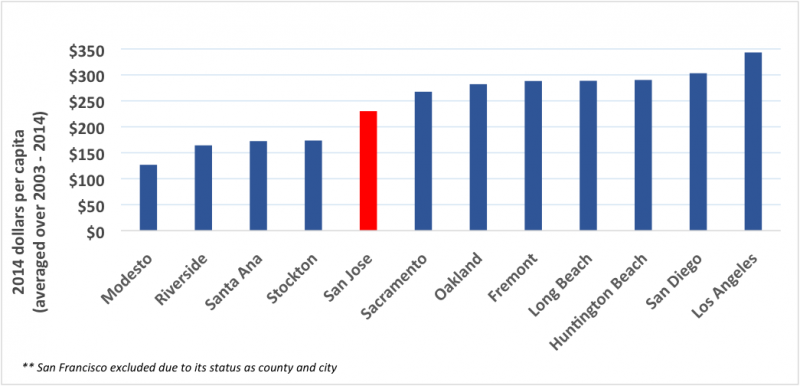
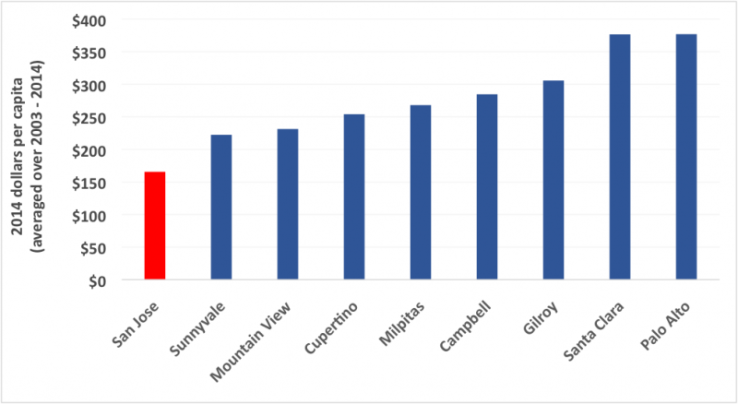
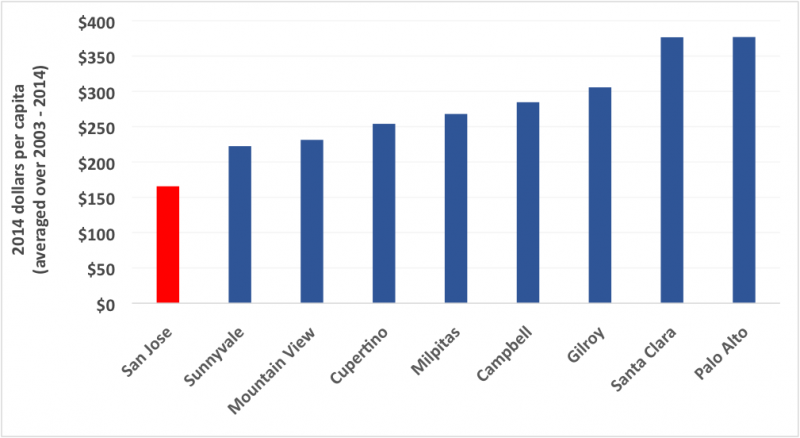
Sales tax is the other big general revenue source for cities. One of the most striking comparisons shows that San Jose’s sales tax revenue is much lower than that of its neighbors in Santa Clara County. This means people who live in San Jose (particularly in areas with little retail) often shop in other cities, or that businesses that sell products to other businesses are often just outside its border — factors the city is already aware of and working to address.
General Sales Tax Revenue Across Santa Clara County
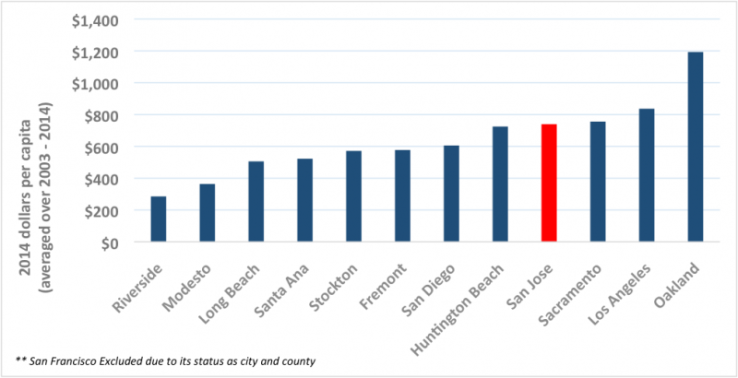
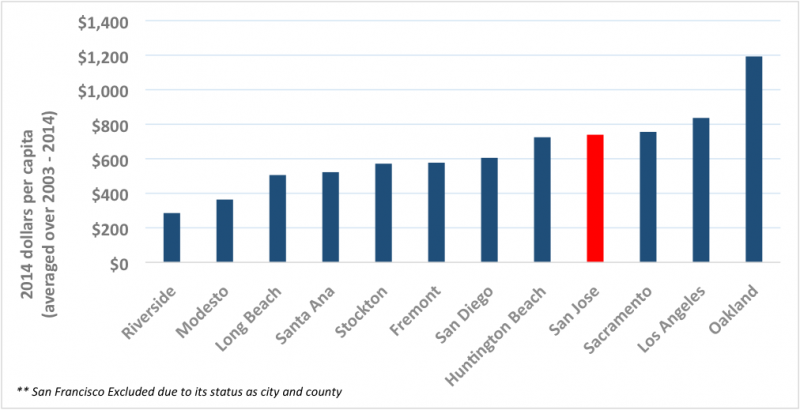
In total general expenditures per capita, San Jose also comes in at fourth place among big California cities, mirroring the first graph. Within general spending, most California cities spend one-half to two-thirds on public safety, and San Jose is closer to the lower end of that range.
General Spending on Public Safety Across Large California Cities

The other core general expenditure categories include the operation and maintenance of parks, libraries, recreation centers, streets, city planning functions and administrative services. When adding those to public safety, San Jose jumps up five places among large cities, landing in fourth place.
Total General Spending Across Large California Cities
Where Do We Go From Here?
While our work at SPUR is still unfolding, we can draw three early conclusions:
First, San Jose is not an outlier among its large California peers in terms of the biggest categories of total general revenues and expenditures. This means it is not alone in its struggle to maintain sufficient revenues in tough economic times. However, had San Jose not cut costs and services, the city’s costs now and into the future would likely have been higher and its overall financial condition worse.
Second, San Jose does lag in property tax by big-city standards and in sales tax compared to its neighbors. These are important revenues and any city would be concerned about this.
Third, cities work with the revenues they have to provide the services they need. Our expenditure graphs above are a reflection of both the cost to provide certain services across cities and each city’s priorities. San Jose has set a goal of restoring its services after the deep cuts and, in this regional economic boom, is able to make progress toward that — but another down-turn might disrupt that plan.
The city, its workers and its residents should take this moment to plan for the future they want and how they want to get there. Given San Jose’s recent spending cuts, the road to restoring full service will likely include raising new revenues, modernizing existing taxes and fees, and implementing the city's long-run economic development strategies.
The City of San Jose has big ambitions to deliver the kinds of quality of public services that will place it among the most livable, most sustainable, most economically dynamic big cities in the country. Our 2016 report will look more deeply at the history and drivers of San Jose’s recent fiscal challenges, as well as how San Jose can turn its tide and fulfill its goals.
A Note on the Methods Behind Our Graphs
Large California cities are those with populations over 200,000. Santa Clara cities are those within the county and with minimum populations of 40,000. Benchmark data are for general revenues and use of general revenues from annual Cities Transactions Reports collected and compiled by the California State Controller’s Office. We use these from 2003 to 2014 (all available years) and deflate all figures to 2014 USD. Deflated dollars are divided by each city’s population for each year. We then average deflated, per capita figures across our 12-year timeframe.