The Bay Area made history this November when — for the first time ever — the majority of voters in two American cities supported taxing sugar-sweetened beverages. In Berkeley, an overwhelming 76 percent of voters approved a penny-per-ounce sugary beverage tax, which will go into effect on January 1, 2015. In San Francisco, 56 percent of voters supported a two-cents-per-ounce tax. However, San Francisco’s proposal required a two-thirds majority to become law, which means the measure lost.
The results raise the question: Why did Berkeley’s measure do so much better than San Francisco’s? It's difficult to gauge which ones were the most influential, but a number of factors were at play:
Dedicating the tax revenue to specific programs
One of the biggest differences between the two proposals was that San Francisco’s dedicated the tax revenue to specific uses included funding recreation programs, physical education in schools and improving food access. Though this provision put in place the 66 percent threshold required for the measure to pass, San Francisco’s advocates believed that it gave their proposal a higher chance of success. Coming off the 2012 rejection of soda taxes in Richmond and El Monte, California, advocates believed that part of voter opposition stemmed from a general distrust of taxes whose revenue would go straight into the municipal general fund. By designing the San Francisco measure to fund specific programs that promoted health — and directing spending to communities most affected by diet-related disease — the belief was that the measure would have more support. In Berkeley, how the revenue was dedicated doesn’t appear to have been an issue. But, in San Francisco, there’s no way to say whether the measure would have gotten more or less votes if the money was not earmarked for specific programs.
One cent or two cent tax
San Francisco’s measure would have increased the price of beverages twice as much as Berkeley’s by charging two cents per ounce, instead of one. Researchers estimate that by increasing the price more, consumption will decline more steeply — resulting in a greater public health benefit. The higher tax would also generate more revenue. Neither of the opposition campaigns in Berkeley or San Francisco focused much of their messaging on the amount of the tax. Instead, the opposition campaigns focused more on the idea of the tax generally, and it did not appear that the level of the tax played a large role in the debate around either measure.
Campaign funding
The American Beverage Association — funded mainly by the soda industry — outspent the proposals’ supporters by wide margins. In Berkeley, a city with 77,000 registered voters, the association spent $2.4 million, according to Berkeleyside. That works out to $31 per registered voter. In contrast, supporters of Berkeley’s tax, with major backing from former New York City Mayor Michael Bloomberg, spent nearly $900,000 on the campaign or $12 per registered voter.
The difference in San Francisco, with its 436,000 registered voters, was even starker. The American Beverage Association, according to the San Francisco Chronicle, poured $9.1 million into the “no” campaign (nearly $21 per registered voter) while supporters raised a total of approximately $275,000 ($0.63 for every registered voter).
In other words, the Berkeley supporters were outspent by roughly 2 to 1, while San Francisco supporters faced a 33-to-1 spending difference.[*] The fact that soda tax advocates in Berkeley won, despite being significantly outspent, demonstrates that money was not the only factor in these races. But, the Berkeley advocates’ more substantial funding allowed them to run advertisements and a campaign that countered the opposition messages at a scale that San Francisco’s campaign could not. Opposition money may not have been the sole reason San Francisco’s proposal failed, but if proponents had the same level of funding as their counterparts in Berkeley, it could have been a key factor in changing the outcome.
Others blame the execution of the “yes” campaign itself, or the lack of unified political support in San Francisco, as main factors for why the SF measure didn’t pass. As with the other variables listed above, it’s difficult to find data to tease out how important those factors were in deciding the race.
What is clear, however, is that the idea of taxing sugar-sweetened beverages has achieved majority status, despite well-funded opposition. Berkeley and San Francisco voters are not representative of all American voters, but numerous policy ideas that are first tried in the Bay Area — from mandatory paid sick days, plastic-bag bans and requiring restaurants to have a non-smoking section — eventually gain wider adoption. The wall of opposition to taxing sugar-sweetened beverages has been breached, and the election results have only increased the energy of advocates who support of the idea.
Directing that energy in the most strategic way will require dissecting the results of Berkeley and San Francisco’s votes, as well earlier votes in Richmond, Telluride and many state legislatures. For instance, the map below shows the percent of yes votes by precinct in San Francisco and raises numerous questions about the reasons behind that pattern. SPUR will be hosting a public forum in 2015 to discuss what the next steps are for sugar-sweetened beverage taxes. Check our events calendar in mid-December for details on that event.
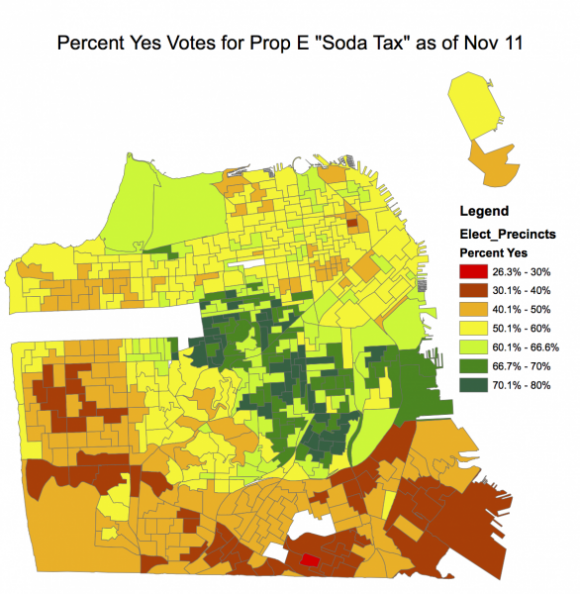
Support for the Proposition E soda tax was largely concentrated in certain geographic areas of San Francisco. This voter data was obtained from the San Francisco Elections Office on November 11, very near the final count of votes. For a set of similar maps for all the propositions, see an article in The Usual Suspects by David Latterman of Fall Line Analytics. Map by SPUR intern Nikki Diaz.
[*Correction: An earlier version of this post incorrectly calculated the ratio of spending for and against Prop E. The post has been updated with revised calculations of the ratio of spending by both sides and also includes revised total spending estimates spent by supporters of Prop E., based on correspondence with the campaign manager ]