
![]()
This publication is a component of the SPUR Regional Strategy, a vision for the future of the San Francisco Bay Area.
In his 1960 book The Image of the City, Kevin Lynch wrote about the places that linger in our minds. For him, the city was best understood through its most memorable places. But there can be a big difference between the city as we imagine and remember it and the city as it is.
SPUR is creating a Regional Strategy for the Bay Area — a civic vision for the region’s next half century and a policy road map for how to get there. With it, we hope to show how the Bay Area can continue to thrive economically and tackle its biggest challenges — like housing, transportation and climate change — while living up to its shared values.
The Bay Area is idealized as a land of opportunity, liberation, invention and openness. In many ways, it lives up to that reputation. But solving the Bay Area’s problems requires a clear-eyed view of the region as it is, rather than as we imagine it to be.
To that end, SPUR has recently completed an in-depth analysis of the entire nine-county region based on built (or unbuilt) form. This analysis divided the region into a grid of half-mile squares and assigned data on land use and physical characteristics to each square. The data was fed into a machine-learning algorithm known as a k-means cluster analysis. Each square came out classified as one of fourteen place types.
Previous efforts to categorize Bay Area land use include the 2002 Regional Livability Footprint, which developed a catalog of place types to guide planning efforts. But SPUR’s place types are different in that they have been generated by an objective process from the data, not from our assumptions or the judgments of planners. This new effort took a page from the Regional Planning Association’s similar analysis of the New York metro area in 2016.
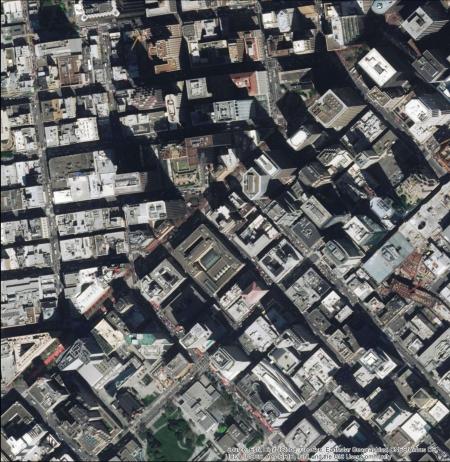
The process was not entirely automated. We made choices about how many place types should be included, for example. We wanted enough types to offer a multifaceted portrait of the physical environment while remaining manageable. We assessed the types that emerged against our own understanding of the region’s history and built form, paying special attention to distinctions we thought were important. For example, the San Francisco’s Financial District, dense and well-served by public transit, is clearly unique in the region, so it ought to be captured as its own type.
These place types are helping us put together an objective profile of the Bay Area’s built environment. What kinds of places do we actually live in? Where are the opportunities for transformative change? By layering basic demographic data on top of these areas, we can begin to understand the equity dimensions of the built environment. Among the things we want to discover are: What kinds of settings are home to vulnerable communities? What sorts of places have created economic enclaves? How many of us live in urban areas? Which settings have the most vacant land? What kinds of places surround our critical transit hubs?
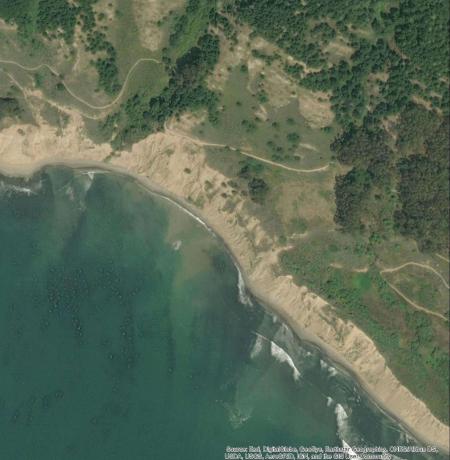
This work will be folded into the forthcoming San Francisco Bay Area Shoreline Adaptation Atlas, a part of SPUR’s ongoing regional strategy work. (Developed in partnership with the San Francisco Estuary Institute, the atlas uses the place types to characterize the built environment of areas that may be subject to flooding from sea level rise.) Place types also offer a tool for aggregating the impact of various policies at the regional scale. What if we could add accessory dwelling units onto 15 percent of the region’s single-family lots? What if we could transform a quarter of car-oriented commercial land into walkable mixed-use neighborhoods? Can we fit all our projected growth into existing urban areas?
The place types have revealed some fascinating realities about the region:
• Roughly 84 percent of the land in the nine-county region is in rural open space or agriculture. Twenty-six percent of that land is already protected.
• Of the urbanized area, about 75 percent is in primarily single-family residential neighborhoods, representing 69 percent of the region’s total housing stock.
• The kinds of dense, mixed-use areas that support walking and high-quality transit make up only 1 percent of the urbanized area but are home to 5 percent of its residents and 29 percent of its jobs. These places have the highest percentages of college graduates and households earning more than $150,000 per year.
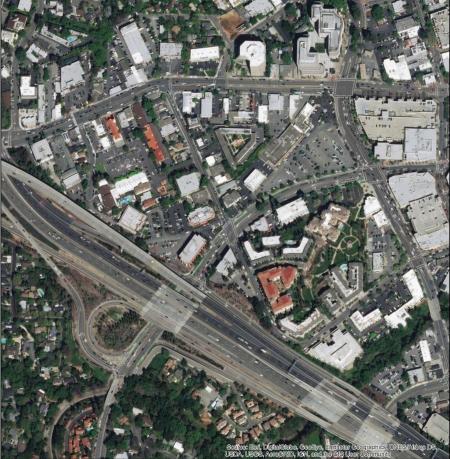
• But nearly 22 percent of the urbanized area (or nearly 250 square miles) is of the low-density commercial type, making these areas ripe for transformation if we can get the polices right.
Ultimately, the place types provide a starting point from which we can roll up our sleeves to begin the generations-long work of creating a more sustainable, equitable and livable region for everyone.
Found mostly in Napa and Sonoma wineries and other crops elsewhere.
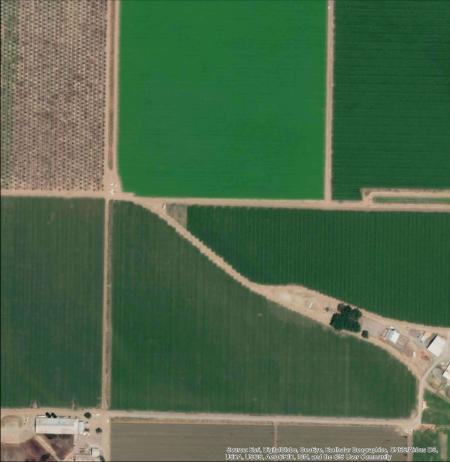
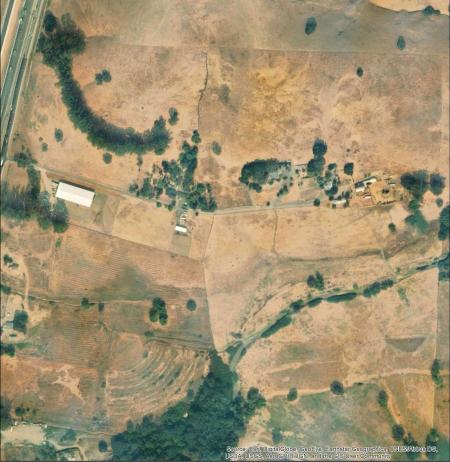
Spread over half the region and includes working lands, sparse housing and more.
Span the region and include federal, state, regional and city parks and more.
Very low-density housing with single family homes at the edge of open spaces.
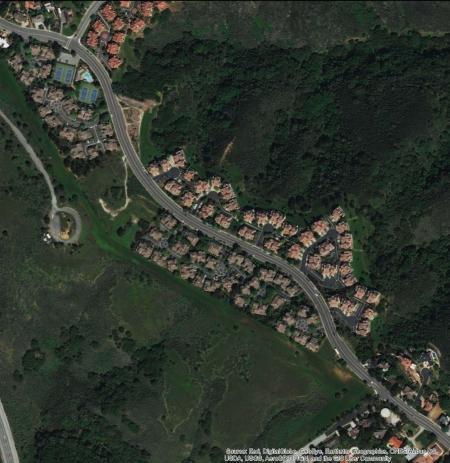
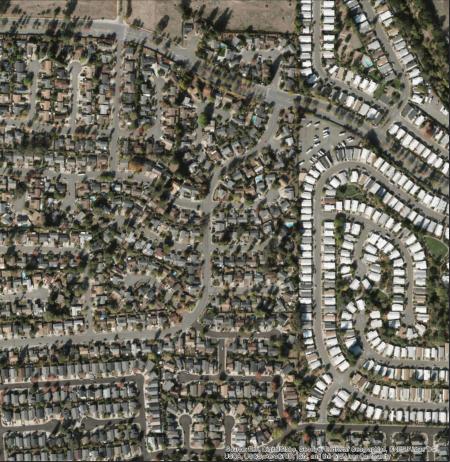
Low-density housing rings the center of almost every city of the region.
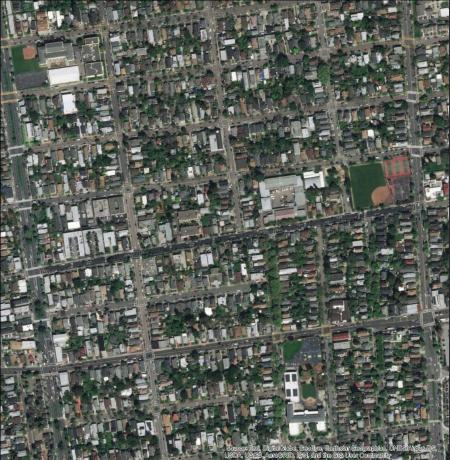
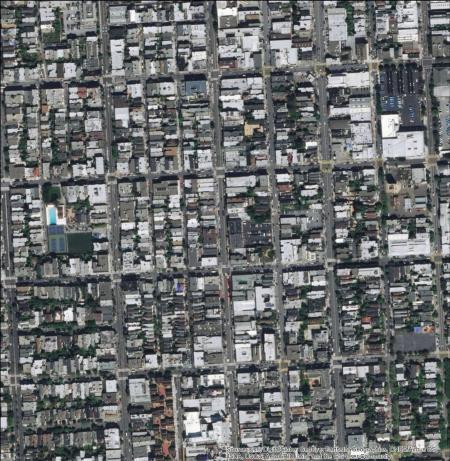
Medium density housing is found mostly in older San Francisco, East Bay and Peninsula neighborhoods.
Very low-density jobs. Large, low-slung buildings with few intersections.

Medium-density jobs. Multi-story commercial buildings in many cities.
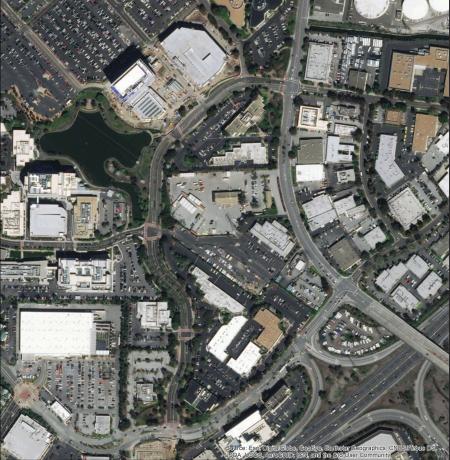
Low-density jobs. One- to three-story buildings for office, retail and other jobs.
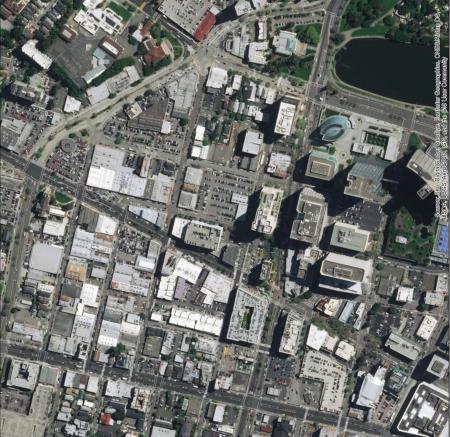
High-density jobs. Ten or more story offices in job centers and large cities.
Multi-family housing, retail and jobs (San Francisco and Oakland only).
Residential and job towers (San Francisco and Oakland only).
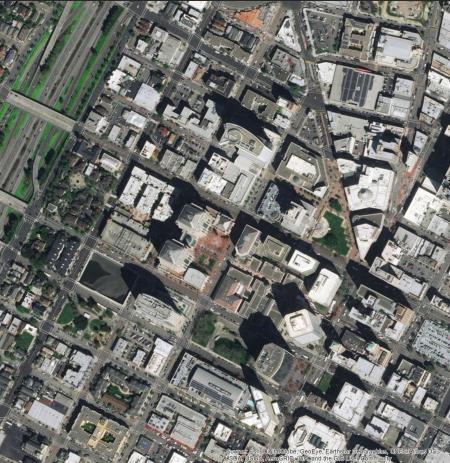
Multi-story housing and jobs on small blocks (San Francisco only).
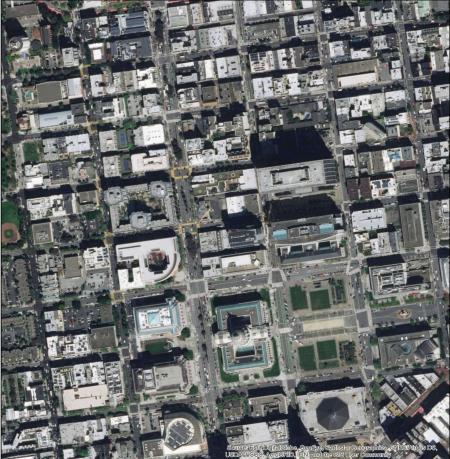
Downtown has the highest job density in the region.