
When BART opened in 1974, many suburban Bay Area communities "downzoned" the areas directly adjacent to the station. When the D.C. Metrorail system opened in 1976, transit planners for Washington Metrorail as well as Arlington County, Virginia, and Montgomery County, Maryland, took a different approach. The Washington Metropolitan Area Transit Authority and local jurisdictions actively pursued development opportunities in the quarter-mile areas around their suburban Metrorail stations and have since then become a national model for suburban "transit-oriented development."
Today, many of these older suburban places have transit ridership, walking and car ownership rates that resemble the densest U.S. cities. These outcomes are directly attributable to the presence of the Metrorail system and the amount and type of development built around the stations. Other factors also play a role, such as the federal government's large presence in the region as an employer with many offices located near transit, and a rail-system design that finds a better balance of high-quality inner-city connectivity with regional commuter service when compared with other systems such as BART that were built during the same period. While this dense, mixed development around Metrorail stations has not replaced auto-oriented sprawl in the D.C. region, it has provided an alternative model for development outside of the urban core.
THE START OF SUBURBAN NETWORKS
In contrast with BART and most other U.S. regional rail systems, many suburban D.C. Metrorail stations are immediately surrounded by a dense building pattern. Often made up of office buildings with increasing amounts of residential and retail, these station areas contrast with the low-density suburban form nearby. Compare this with the land-use patterns around BART stations like North Berkeley, Ashby, Fremont and MacArthur, where the suburban development is virtually unchanged since the 1970s.
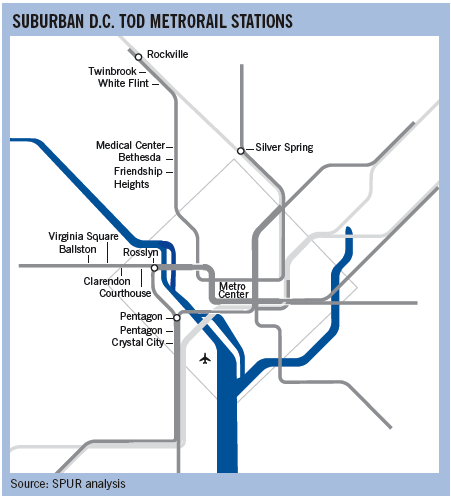
In particular, the Rosslyn-Ballston Corridor in Arlington County has seen the most change. (For sake of comparison, this corridor of older suburbs is similar to parts of the inner East Bay.) Since 1972, when Metrorail first opened, the corridor has grown from close to 30,000 to nearly 80,000 total jobs.1 This two-square-mile corridor would occupy fourteen square miles if it were built at typical suburban densities. In the areas around the five main stations (typically a quarter-mile area) there is nearly 60 million square feet of total development.2 For Arlington County overall, by 2000, nearly two thirds of all jobs and 40 percent of housing units were near Metrorail stations. And since Metrorail opened, 75 percent of new development in Arlington County has been located near a rail station. Surrounding the Rosslyn station alone, there is over 18 million square feet of development, with slightly more office than residential development.3
In the newer suburban Montgomery county, Maryland (think Contra Costa county), dense developments exist around stations such as Silver Spring, Bethesda and Friendship Heights (with 15,000, 10,000 and 10,000 daily metrorail boardings respectively). Silver Spring has 7.3 million square feet of office space, 5,200 housing units, and a population density of 15,600 people per square mile — nearly as high as San Francisco's.4
MEASURING SUCCESS
The density and mix of uses immediately surrounding suburban Metrorail stations is the most obvious indicator of TOD success. But to measure outcomes, travel choices are the most important indicator of the effectiveness of suburban TOD.
Over 30 percent of D.C. residents who work outside the city take transit. This compares with only 17 percent of San Francisco residents who take transit to their jobs outside of the city. In general, it is difficult to get a large share of residents to choose transit over driving for reverse commute trips. Not only is there less congestion leaving the city in the morning commute, but parking is usually cheap or free in the suburbs. So to attract reverse commuters, transit must be particularly convenient and work destinations must be directly adjacent to suburban transit. Due to the design of many Metrorail stations outside of D.C., this is the case for many reverse commuters.
The transit use for reverse commuters is even higher when going to jobs at suburban TOD locations. For example, at the Silver Spring Metrorail Center in Montgomery County, Maryland — a 150,000-square-foot office tower 200 feet from the exit of the Metrorail station — 52 percent of workers residing in D.C. took rail to work.
Reverse commutes are important because they make more efficient use of existing infrastructure. Each additional rider in the primary commute direction puts additional strain on already-crowded infrastructure. In contrast, it costs the transit agency very little to fill empty seats in the reverse commute direction, so these fares help to cover operating costs without minimal pressure on capital infrastructure.
High transit use during off-peak periods is just as critical. Suburban residents who would ordinarily drive their cars are taking transit for short, non-work trips. This travel pattern improves efficiency by adding riders during off-peak times when there is available capacity. Similar to reverse commuting, riders captured during these times add fare revenue without adding significant operating costs. Off-peak riders provide a market for retail development at off-peak times, which in turn contributes to a safer, more pedestrian friendly station area.
The low rate of car ownership by residents who live and work near suburban TODs contributes to a healthy dependence on the transit system. In 2004, 38 percent of both Ballston and Rosslyn area residents commuted to work by transit versus 42 percent who drove alone. Ballston area households had 1.2 automobiles per household and Rosslyn 1.1 per household, a very low rate for households outside the region's central city. By contrast, the average San Francisco household has 1.1 cars per household and the national average is 1.5 cars per household.
Users of certain suburban Metrorail stations also have exceptionally high walking rates. The graph on page 16 summarizes these statistics for several key suburban stations.5 Arrival and departure from a station by foot is a measure of a successful TOD. In short, this gets more cars off the road, reduces traffic impacts on surrounding neighborhoods, reduces the need for parking lots around stations and provides significant foot traffic to enhance safety and enable more successful retail.
The operational efficiencies resulting from the travel behavior discussed above are apparent in the proportion of the Metrorail operating budget that is covered by fares, known as the farebox recovery ratio. For Metrorail the farebox recovery ratio was 71 percent in fiscal year 2008.6 In contrast, the farebox recovery ratio for BART was 52 percent in fiscal year 2007.7
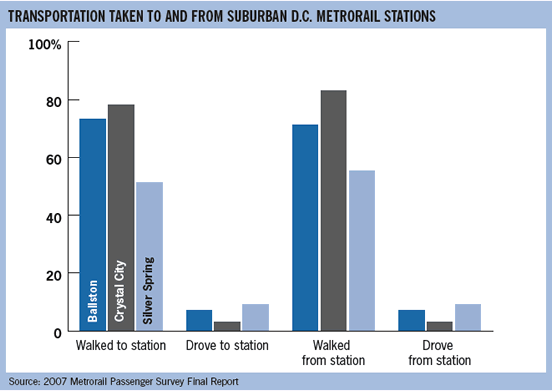
More than 66,000 riders were interviewed for the 2007 Metrorail Passenger Survey to learn by what means (foot, car) riders came to the station, and upon arriving at their stop, how they reached their destination.
WHY IT WORKS
1. Long-term planning and investment.
The high quality and dense environments around suburban Washington transit stations began from the earliest investment decisions. Often, system planners selected more expensive station locations that enabled transformational development patterns, as opposed to locations in existing highway or freight rail rights-of-way. With these up-front investments came patience in realizing a vision. It took 20-25 years for the Rosslyn-Ballston corridor to reach critical mass.
2. Recognized revenue potential from development.
The transit agency, Washington Metropolitan Area Transit Authority, had a fiscal imperative to promote joint development near the stations because it lacked any dedicated funding source. Putting more development immediately near stations provided more riders and revenues. More recently, WMATA has been able to sell the land directly to developers and keep the proceeds (instead of long-term leases, which attracted less interest from developers).
3. Secured local political support from surrounding communities.
The earliest success in TOD occurred in Arlington County where political leaders argued that the Metrorail could be used to help revive a struggling economy. The approach of the political leaders succeeded because of support and buy-in from the local residents who were very involved in decision-making. Resident support was premised on a firm commitment to contain the dense development in a roughly one-quarter mile radius around the stations.
4. Protected existing neighborhoods.
The political leadership made a commitment to protect the existing low-density neighborhoods surrounding the TOD. They also pioneered "zone parking" in areas adjacent to major corridors by restricting parking in the neighborhoods next to job centers. Residents would get parking permits while commuters would not be allowed to park in the nearby residential areas.
5. Recognized local government fiscal benefits to density.
Given the large public debt from the construction of the Metrorail system, building large amounts of development around the stations was an easy way to pay off this debt through additional property taxes and joint-development agreements without raising taxes for others in the community.
6. Captured more land around the stations than was needed.
WMATA purchased significant amounts of land around suburban stations as it expanded. Because the land uses at the time often had been for farming, the parcels were large and they purchased more land than they needed.
APPLYING IT ELSEWHERE
Some elements of the D.C. TOD story are difficult or undesirable to replicate. For example:
- The federal government has a policy (dating to the Carter Administration) to locate federal agencies near Metrorail stations. Federal employees represent nearly 50 percent of all peak period Metrorail riders, providing an unusual boost for some suburban stations. In addition, the federal government has for years provided employees with a $120/month transit subsidy (recently increased to $230/month) — a huge additional incentive for many D.C. region residents to depend on Metrorail.
- D.C.'s restrictive height limits made surrounding centers relatively attractive for high-rise, signature office and residential towers, and helped push development that might otherwise have been within the city core into suburban locations.
- For years D.C. had a very poor reputation because of crime and unreliable government services. In other cities, this might have led to complete abandonment. In the case of D.C., as the nation's capital, this was not an option. This made locations outside the city, but with very good access, unusually attractive for development.
- D.C. property taxes were higher than the suburbs.
- Some of the development occurred in suburban areas just outside the city, which makes some of them more like extensions of the urban envelope rather than distinct suburbs.
- D.C. has low auto-ownership, which increases the likelihood that D.C.-based reverse commuters will use transit. This supply of transit-dependent suburb-bound commuters helps support efforts to create walkable suburban job centers.
Some lessons from the D.C. area's TODs are more applicable to other regions. For example, we can learn from:
- A transparent and dependable development review process that instilled confidence from residents and developers. There was a strong commitment to boundaries for more intense development and protections offered to surrounding, lower-density areas that reduced conflict in the development process. Likewise, jurisdictions established clear processes for developers.
- A commitment to a balanced mix of uses. Jurisdictions that are part of WMATA have been committed to balancing residential, office and retail uses around stations. For example, Arlington County required residential development at Metrorail stations even when the market strongly favored retail and commercial. This resulted in more consistent use of the rail network and an environment where retail could thrive and support more feeder-transit services.
- Connections to existing downtowns. The downtown area in Silver Springs, Maryland predates the development around its Silver Springs station, located just beyond the town center. Like many downtowns it had declined in the 1960s and 1970s with the rise of other suburban locations, particularly nearby shopping malls. However, with the introduction of the Metrorail station, the National Oceanic and Atmospheric Administration relocated near the station. Later, Discovery Communications consolidated several office buildings into a single structure next to the station. Retail and residential development have since followed, closely connecting the older downtown with the development immediately next to the station.
Ultimately, while there is much to learn from the success of specific development near the transit stations, D.C. also shows us that transit-oriented development will not alone prevent sprawl. Development around transit stations is only a small part of retrofitting suburbia. Areas immediately beyond D.C.'s model TOD stations remain at a standard low-density suburban pattern. The D.C. suburbs and exurbs extend deep into rural areas in Virginia and Maryland because there are no physical barriers and there are existing patterns of small towns around which to sprawl. Drive-alone rates to many of the suburban job centers are scarcely better than those in the Bay Area. And some of the major employment centers do not yet have transit (though there are plans to extend the Metrorail to Tyson's Corner, which, at 22 million square feet of office space, is twice the size of downtown Oakland).
But the suburban TOD that SPUR encountered at D.C. suburban Metrorail stations illustrates an alternative path for willing communities of the more than 100 rail stations in Northern California.
ENDNOTES
1 Leach, Dennis M. Rosslyn-Ballston Corridor Arlington, VA30 Years of TOD Community Outcomes & Performance Measurements.
2 Arlington General Land Use Plan, amended through April 2004.
3 Ibid.
4 Source: http://www.montgomerycountymd.gov/mcgtmpl.asp?url=/Content/RSC/SilSprng…
5 Walk and drive data to Metro stations are based on the 2007 Metrorail Passenger Survey Final Report.
6 WMATA Approved Fiscal 2010 Annual Budget.
7 San Francisco Bay Area Rapid Transit District Independent Auditor's Report, 2007 and 2008.