One of the key causes cited for the Bay Area’s housing affordability crisis is that demand for housing continually outstrips the available supply. If only the region had built more housing, the reasoning goes, extreme competition for a limited number of units wouldn’t be driving prices so high. But is the problem really a simple mismatch of supply and demand? And how much housing should the region have built in order to solve it? This article presents new data to answer these questions.
As part of SPUR’s Regional Strategy we are researching how much housing the region needs to build at all income levels in order for the Bay Area to become more affordable over the next 50 years. To get to an answer, SPUR started by working with the Concord Group to analyze the housing shortfall between 2000 and 2018. The first step was to determine how much housing the region should have built during that time period for housing to remain affordable to median income households (based on the affordability standard that housing costs should be no more than 30 percent of household income).
What we found is that since 2000, the Bay Area should have added 1.05 million housing units. Instead, only 380,000 units were built during this time — 316,000 market rate and 42,000 subsidized affordable units. This means the region fell short by 700,000 housing units.
These numbers show that a dramatic shortage of new housing in in fact a key cause of the current crisis — with an important nuance. Who that housing serves is a crucial part of the picture.
Finding 1: The majority of the missing 700,000 units of housing impacted those earning less than the median income.
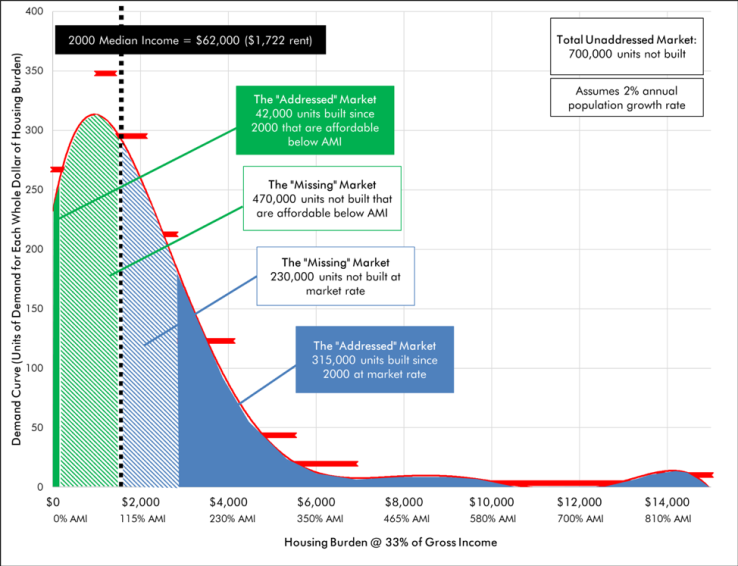
The “missing market” should have included 470,000 rental units priced at less than $2,000 per month for those under the median income and 230,000 units priced between $2,000 and $3,000 a month for those at or above the median wage.
Instead, the housing market produced 316,000 units with rents of $3,000 and up per month. So the region’s wealthiest residents were the ones served by the market, and they outcompeted everyone else for a scarce number of units. Meanwhile the 42,000 subsidized units, built with public and private resources, met only a fraction of the need for subsidized housing, which was closer to several hundred thousand units.
The following chart shows how much households at different income levels could afford to pay for housing and still meet the standard of spending 30 percent of their income or less on housing.
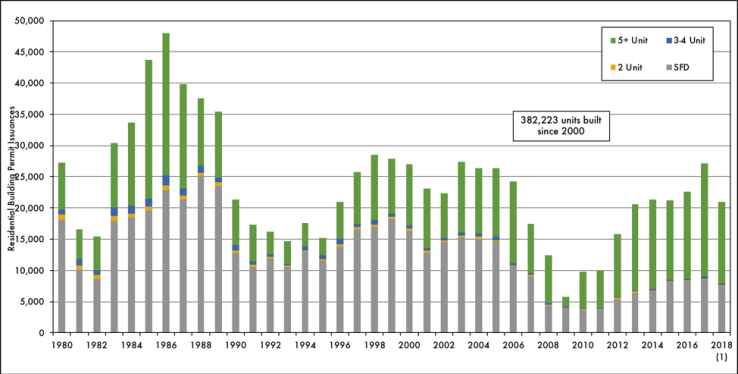
Finding 2: The Bay Area produced well under 30,000 housing units every year since 1990, a significant decline from the mid 1980s.
Housing production naturally rises and falls with the economy. But the region unquestionably reduced its overall housing production in the past two decades. The low production compounded on itself as an unfilled backlog, leading to ever-increasing prices. The only positive sign is that the share of single-family detached (SFD) homes is significantly lower, reflecting an increase in overall density. But there was no increase in production of apartments, which are at the same levels today as in the mid 1980s.
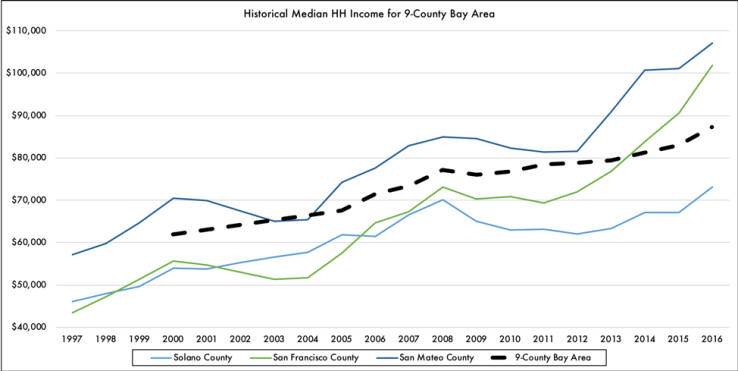
Finding 3: The Bay Area has gotten significantly wealthier as new residents were often those who could afford the increasing prices.
Since the late 1990s, the Bay Area’s median income has grown rapidly from close to $60,000 per year to close to $90,000 (unadjusted for inflation). In other words, the region got 50 percent wealthier.
Given how housing markets work, wealthier residents outcompeted everyone else in a constrained housing market and effectively set the price for new units. When this happens, households with less money have no recourse: All they can do is pay a bigger and bigger percentage of their income for housing and make up the difference by skimping on other expenses, sometimes including retirement savings, health care or even food.
https://fred.stlouisfed.org/series/MHICA06075A052NCEN
Summary
As a result of the constrained market and low supply of new housing, the region became both less affordable and significantly wealthier since 2000.
What happened to everyone who wasn’t wealthy enough to afford a market-rate unit or lucky enough to both qualify for and be selected for a subsidized unit?
- Many are now rent burdened, meaning they pay more than 30 percent of their income on housing. According to a 2018 PolicyLink report, half of all renters by 2015 were rent-burdened, an increase from 39 percent in 2000. Over 60 percent of black, Latino and Native American households are rent burdened.
- Some are living in overcrowded units (more than one person per bedroom).
- Some left the Bay Area, either moving to the Central Valley and commuting back for work or leaving the Northern California megaregion entirely.
- Too many are homeless.
- And some never came here to begin with. In other words, the lack of housing production disproportionately limited who could be part of the Bay Area’s great communities and dynamic job markets. Many who wanted to move to the Bay Area but couldn’t afford it instead chose to live in other regions.
The solution will need to include building a lot more housing — but not just at market rate. First, the Bay Area needs a significant increase in the supply of new housing to prevent middle-income and lower income residents from being severely harmed — or never getting to become part of the region to begin with.
Second, the new housing must be delivered and priced at various levels that are affordable to those at or below median income. As inclusionary housing expert Rick Jacobus argues in a recent article, the housing market is segmented, which means those seeking housing naturally look for a specific type of housing at a particular cost in a particular location (e.g. students look for student housing near a university). But in the Bay Area, if virtually all new housing is added at the high end, the wealthy are served and everyone else has to increase their spending beyond what they can reasonably afford in order to access the new housing and remain in the region.
Finally, new supply must be combined with policies that protect vulnerable tenants and preserve existing units that house people with low incomes.
This is what the CASA Compact — a proposal to build 35,000 new housing units a year, preserve 30,000 affordable units and protect 300,000 lower-income households — set out to achieve. But if the Bay Area meets CASA’s goals, will it be enough? Over the course of the next year, our work on the SPUR Regional Strategy, a 50-year vision for making the Bay Area affordable and equitable, will help to answer that question. In our next article on this subject, we’ll take a look at how much housing the Bay Area will need to build going forward to dig out of the current crisis.