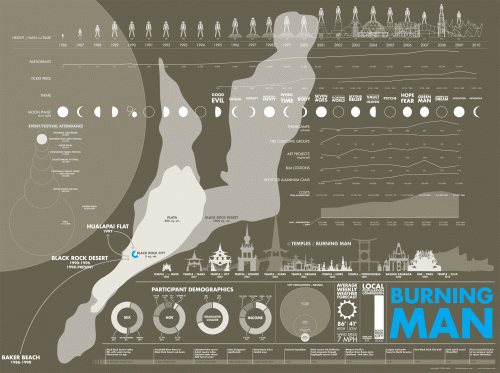
Flint Hahn's Burning Man infographic. (Click to view larger.)
For some it is a yearly spiritual revival providing an emotionally charged respite from reality; for others it simply means they are able to eat brunch without standing in line. The mark left by Burning Man on San Franciscans and this city is undoubtedly immense, but is hard to truly measure. The same can be said about the impact on Black Rock City, Burning Man's yearly home, but this stunning infographic provides an all-encompassing perspective on the event.
Over the course of two weeks, from conceptualization to final graphic design, Flint Hahn, a six-year veteran of the event, put together this infographic. He gathered the data needed from post-event after reports on the Burning Man web site, contacting various departments in the organization, the Nevada Bureau of Land Management, NASA historical astronomy data, online population sources, Flickr, Wikipedia, among a variety of other sources. Regardless of the amount of data collected, Flint was well aware that displaying the true essence of Burning Man through data could never be achieved. Flint stated, "This is an event based on personal experiences. I could produce many interesting statistical trends, eye-catching illustrations, and visual charts, but it would never capture what the event is. It's a common question with unlimited answers, "What is Burning Man?" If anything, this infographic may be the antithesis of what Burning Man is." As we at SPUR found out this past spring when we hosted Burning Man's founder, Larry Harvey, some questions are better left unanswered.
To find out more about the design process I asked him about the most challenging elements of the graphic. According to Flint, "Between the Temples and the Man with its accompanying base, those two sets of illustrations were the most challenging facets of this poster. " Datasets were not made available, or may not even exist for those projects. Also, limitations based on design feasibility, budget, and location made for significant differences between the original renderings and the ultimate result. Flint improvised by "determining the respective sizes for the temples due to the nature of this event being highly documented in photographic form. Using long shots of the temple with people nearby, one may base the structure's height by calculating the average height of the people in relation to the scale of the structure."
This graphic is, however, built upon hard data — ticket price, number of attendees, etc. In 2008, for example, $771,000 was spent on portable toilets alone. When first glancing at this graphic it is easy to spot the decline in attendance, overall budget, and several other important indicators last year. While it is unclear if the changes in pricing structure can counteract the lagging economy, for those out on the playa, these numbers are largely irrelevant.
Stand-Out Data:
Number of Theme Camps - 746 (2008)
Total expenditure — $12,317,000 (2009)
Theme in 1999 — Nebulous Entity