Each February, SPUR’s Municipal Fiscal Advisory Committee brings together top economists and city staff to forecast what San Francisco’s economy will do in the year ahead. The expertise of independent economists and experts from key sectors — including real estate, hospitality and retail — helps the City Controller’s staff as they develop revenue projections for the upcoming fiscal year. Here’s a look at what they see ahead.
The Bay Area economy continues to outperform the nation — and the world.
Nationally, gross domestic product is trending down to 2.5 percent over the next two years — modest growth that’s slower than the historic average. The outlook for the year is buoyed by low energy prices, which act as a net stimulus to the U.S. economy. Also of note: American household debt is at a historic low, and consumer confidence has risen back to pre-recession levels. Together, these factors could amount to an uptick in consumption that could drive the national economy into more positive territory.
On the global stage, the U.S. economy is a success story. But nationally, the recovery is bifurcated. People with 20th-century skills are still struggling to find full employment. In California there’s a marked difference between the coastal counties and the inland counties in employment-loss recovered.
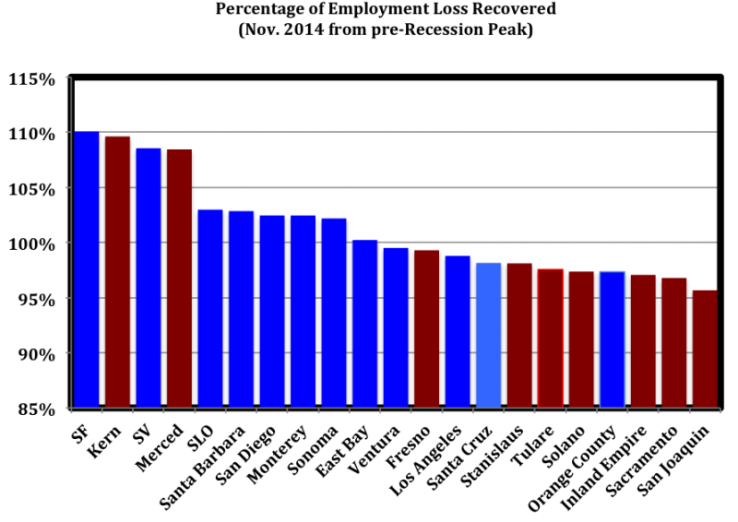 Around the nation, the places that have experienced a recovery have either a tech economy or an energy economy. The Bay Area has the strongest tech economy in the world, increasingly centered in San Francisco.
Locally, this will be a year of moderating growth, driven by a maturing tech sector.
While growth in 2015–16 is expected to slow to a more moderate rate than experienced in the exceptional boom years of 2013 and 2014, San Francisco’s economy is still expected to grow faster than nearly all other large cities in the country. In the three years between 2011 and 2013, the expansion of San Francisco’s economy outpaced the four largest growth years of the dot-com boom. There are now more people employed in San Francisco than at any point before in the city’s history.
Total San Francisco Employment, 1990-2013*
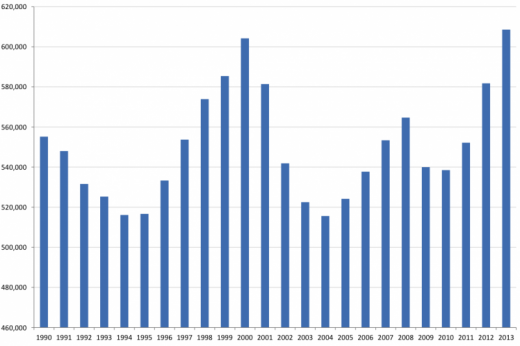
*2014 employment numbers come out in summer 2015 and are expected to be even higher than 2013.
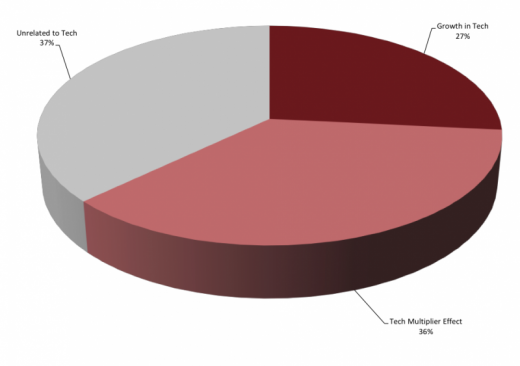
This pattern of growth is driven by the growth and maturation of the tech sector. Tech has grown as a portion of the local economy from just 1 percent of San Francisco jobs in 1990 to 4 percent in 2010 to 9 percent at the end of 2014 (a broader definition of “tech” pegs the sector at 13 to 14 percent of San Francisco’s economy).
While still a relatively small industry, the tech sector has accounted for 27 percent of San Francisco’s job growth since 2010. If you consider the “multiplier effect” of tech employment (how many local jobs are created by each added tech worker), tech is responsible for two-thirds of San Francisco’s employment growth.
2012-13 Growth by Source
There are a variety of risks to growth, but how concerning they are depends on where you stand
San Francisco’s economy is exposed to risk from macroeconomic, or external, risks as well as risk associated with having a volatile industry (tech) as its primary economic driver.
On the macroeconomic side, economists are keeping their eyes on a few things: the impact of low oil prices, the strengthening dollar and interest rates. There is a rising risk of a change to interest rates affecting the local economy. The investment pouring into the Bay Area is partially motivated by historically low federal interest rates. The economists present suggested that the Federal Reserve may start to back off zero interest rates in the near future. This will certainly have an effect on consumers, businesses and financial markets, as well as on the steam of local investment — increasing the cost of borrowing money for projects and opening up alternatives outside the Bay Area for investors.
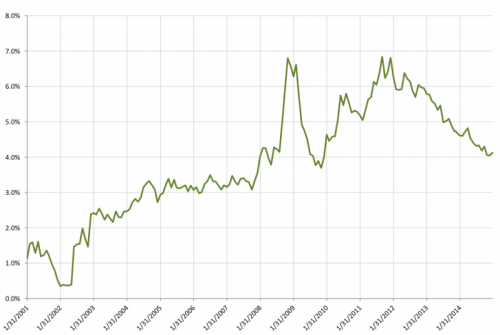
There are also risks inherent to having a tech economy — namely market saturation and the formation of speculative bubbles. But neither appears to be an issue yet for the Bay Area economy. Nationally, equipment and software spending is expected to grow at an 8.8 percent rate this year and 6.6 percent in 2016. A significant portion of these dollars finds its way to the Bay Area firms producing most new platforms, programs and hardware. Growth of a tech economy slows when the market becomes saturated with new technology, but in the Bay Area there doesn’t seem to be an impending run-out of new and transformative technologies. And while a bubble formed in the dot-com boom, the conditions are very different now — with more mature firms, leveraging less risk. The indicator many economists look at to diagnose a bubble in tech is the ratio between the price of a firm’s stock and its earnings. When these two get extremely out of sync, a bubble can be predicted. Currently, most observers consider Bay Area tech-firm stock prices to be at a stable ratio to the value of their assets, though earnings yields are on a downward trend — something to keep an eye on.
Earnings Yield for NASDAQ 100, 2001-2015
Some kinds of risks are unique to the Bay Area.
The Bay Area is also exposed to some unique internal risk in its labor market and regulatory environment.
Unemployment is nearly down to 5 percent in San Francisco. A tightening labor market has the impact of driving higher wages for workers and an influx of people seeking opportunity. A growing population is putting pressure on existing housing, office space and infrastructure, all of which are struggling to expand within the constraints of the Bay Area and San Francisco’s regulations on physical growth.
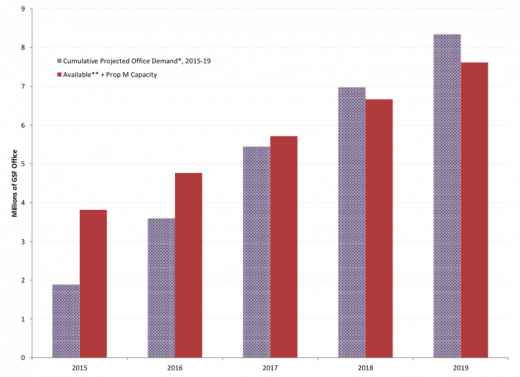
Of greatest concern to most forecasters is San Francisco’s Prop. M. This 1986 growth cap limits the amount of office space that may be entitled in San Francisco each year. Demand for new office space is now approaching the limit allowable under Prop. M, and prices are responding. San Francisco office space is expected to surpass the cost of Manhattan’s this year for the first time in history. By 2018, demand for San Francisco office space will exceed supply, which will affect what kinds of businesses can find and afford space to locate or grow in San Francisco.
Cumulative Projected Office Employment and Potential Space
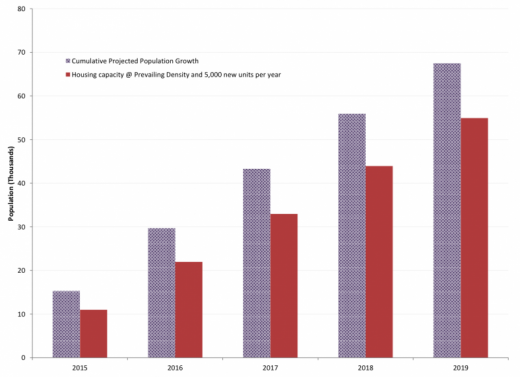
In a similar way, San Francisco’s constrained housing supply and limited regional transportation connections act as a check on the growth of the labor force. There may be more jobs available in San Francisco, but there are an increasingly limited supply of available and affordable places people can live in order to work in them. Even assuming 5,000 units of new housing are added to San Francisco in each of the next few years (a goal the city has never yet sustained), the city would still have far fewer dwellings than there are people wanting to live here.
Housing Capacity and Population
Average Home Values in U.S. Cities
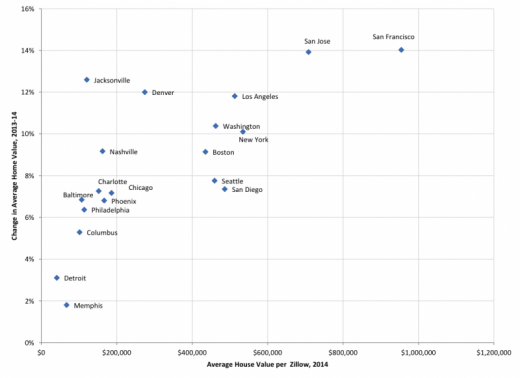
San Francisco housing is the most valuable and fastest appreciating of all large U.S. cities.
Statewide in California, there is a long-term trend to construct more multifamily housing, the type demanded by most urban workers today. But the places where there’s demand are harder to build in. This phenomenon is also acting as a constraint on the full recovery of the construction sector in California.
The booming economy means increased revenue for San Francisco.
While high prices for real estate are bad news for most San Franciscans — only 14 percent of whom can afford the median price of for-sale homes in the city — the boom in local wealth is a boon for the city budget.
The city gets the majority of its general fund revenue from property tax, business tax, sales tax, hotel tax and transfer tax. All sources are projected to increase modestly this year as home values go up; more businesses open, expand and hire; more investments are made; and more people move to the region, each contributing to the city’s coffers as they make and spend money.
This year marks a major change for San Francisco business tax receipts as the new gross receipts tax structure passed by voters in 2012 is fully phased in. The gross receipts tax will replace the prior payroll tax on earnings. SPUR advocated for this switch to a more common and stable tax structure, and we anticipate a more reliable revenue stream coming from businesses this year and forward.
City staff members presented their initial assumptions for receipts in 2015–16 and the next five years (through 2019) across each of the major categories of revenue. The experts assembled found most of the city revenue assumptions conservative, i.e., those in the industries are anticipating much larger revenues and tax receipts than the city had initially forecast. This is positive for the city, if it turns out to be true. It means more money for city programs and more funds to invest in infrastructure.
The city should make use of its economic fortune to invest in shared prosperity and plan for the future.
SPUR is working to ensure that the city takes advantage of this time of wealth with an eye to the long term, and to making sure more people can share in it. This is the time to save for a rainy day and to make the investments in housing affordability, the transportation network and education, health and social services that are vital inputs to lasting prosperity for the region’s residents.
Thank you to San Francisco Chief Economist Ted Egan and to Jerry Nickelsburg, senior economist at the UCLA Anderson Forecast, for providing the data and graphs in this post.
Thank you to the Controller’s Office and the many consultants who contribute their expertise to help San Francisco develop its budget.